The period analyses were performed using Hao's program (1991), the
program PERIOD
(Breger 1990)
and PERIOD96
(Sperl 1996). In
these programs all parameters of pulsation are obtained using a combination of
single-frequency Fourier transforms and multifrequency least squares of
brightness residuals (LSR). The detailed procedure of period analyses
is referenced in
Liu's papers (1995, 1996).
Besides our data set,
we made period analysis for Li and Jiang's data set obtained in 1991
(Li & Jiang 1992)
which is the only available data set in the
literature. Moreover, we combined the two data sets into one and made period analysis
for this long data set so as to obtain a coherent solution. The data points
of the combined data set are shown in Fig. 1, where the ordinate is the
magnitude difference of HR 5437 and comparison star normalized to zero.
The abscissa is the time
(+HJD 2448000). All computed results for
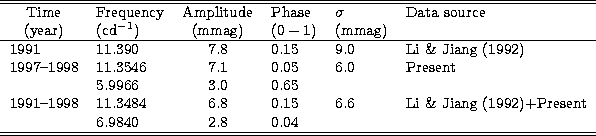
the three data sets are given in Table 2. In Table 2 the frequency is
in cycles per day, the amplitude and standard error are in milli-magnitude,
and the phases are normalized to 1. ![]() is the standard errors of
fitting.
is the standard errors of
fitting.
From Li and Jiang's data set we only confirmed one frequency of 11.390 cd-1. Prewhitening the first frequency, it seems that there is a peak around or larger than 6 cd-1 in the power spectra. Due to the low observational accuracy and less data points the second frequency could not be confirmed. From our data set we obtained two frequencies: 11.3546 and 5.9966 cd-1. However, the value of second frequency is not stable throughout our whole procedure of data processing. While changing the amount of the data points we found that the value of second frequency varied around or larger than 5.9966 cd-1 sometimes. Although the quality of our data set is good, the quantity still is not enough to obtain a satisfactory result. From the combined data set we obtained two frequencies: 11.3484 and 6.9840 cd-1. They can fit the data points very well (see Fig. 1). The power spectra of the combined data set are shown in Fig. 2 together with the spectral window. Power spectrum (01) is obtained from the original data. The frequency with strongest power is the first frequency of 11.3484 cd-1. Power spectrum (02) is obtained from the residuals (original data minus first frequency). The frequency with strongest power is the second frequency of 6.9840 cd-1. It is very obviously higher than others. So, we think that the two frequencies obtained from the combined data set are reliable.
![\begin{figure}
\includegraphics [width=16cm,height=21cm,clip]{ds8372f1.ps}\end{figure}](/articles/aas/full/1999/12/ds8372/img7.gif) |
Figure 1: The data points and fit curves of HR 5437 during 1991-1998. The ordinate is the magnitude difference of HR 5437 and comparison normalized to zero. The abscissa is the time (+HJD 2448000). The fit of the two-frequency solution given in Table 2 is shown as a solid curve |
![\begin{figure}
\includegraphics [width=16cm,height=12cm,clip]{ds8372f2.ps}\end{figure}](/articles/aas/full/1999/12/ds8372/img8.gif) |
Figure 2: Power spectra of the 1991-1998 data set of HR 5437. Power spectrum (01) is obtained from the original data. The frequency with strongest power is the first frequency (11.3484 cd-1). Power spectrum (02) is obtained from the residuals (original data minus first frequency). The frequency with strongest power is the second frequency (6.9840 cd-1). Power spectrum (03) is obtained from the residuals (original data minus first and second frequencies). The ordinate is the power (mag2). The abscissa is frequency (cd-1) |
Copyright The European Southern Observatory (ESO)