 |
The total apparent magnitude of a galaxy was read off the growth curve at a sufficiently large radius (i.e. where the growth curve becomes asymptotically flat). The model-free effective radius was simply read at half of the total growth curve intensity. The effective surface brightness is then given by
| |
(1) |
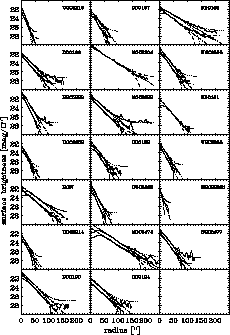
Surface brightness profiles were obtained by differentiating the
growth curves with respect to radius. For 20 of our sample galaxies
the resulting B and R profiles are shown in Fig. 3.
No profile could be constructed for UGCA 342 due to a bright nearby
star (cf. Sect. 6 and Fig. 2). The profiles
have been slightly smoothed (with a running window of width ![]() ) and are plotted on a linear radius scale.
) and are plotted on a linear radius scale.
 |
Figure 3:
Radial surface brightness profiles of the observed dwarf
galaxies in B (lower) and R (upper) except for NGC5204 (only
R) and DDO181 and MCG 9-23-21 for which only B data are
available. The dash-dotted lines represent the exponential fits, as
described in Sect. 4.2 and the dashed and dotted lines
represent the error envelopes as described in Sect. 4.4. The
radii are all equivalent radii ( |
 |
(2) |
| |
(3) |
The deviation from a pure exponential law is expressed by the difference between the total magnitude of an exponential intensity law given by
| |
(4) |
 |
Figure 4: Radial B-R colour profiles. The dot dashed lines represent the exponential fits, as described in Sect. 4.2 and the dotted lines represent the error envelopes as described in Sect. 4.4 |
The largest contribution to the uncertainties in the global
photometric parameters is from the photometric calibration. As the nights
were non-photometric, one must beware of uncontrollable errors in the
zero-point and the extinction coefficient. The statistical uncertainty
on the photometric calibration is of the order of 0.1 mag, due to an
uncertainty of ![]() mag and
mag and ![]() on the zero-point and
the extinction coefficient, respectively.
on the zero-point and
the extinction coefficient, respectively.
The uncertainties on the photometric profiles at low levels are
dominated by the non-flatness of the sky background. The
pixel-to-pixel fluctuations caused by photon shot noise are averaged
out by measuring azimuthally averaged profiles. At typical sky levels
of the order of ![]() in B, and
in B, and
![]() in R, and a flat-fielding
accurate to
in R, and a flat-fielding
accurate to
![]() of the sky background, the sky
fluctuations reach values similar to the the galaxy profiles at
respectively
of the sky background, the sky
fluctuations reach values similar to the the galaxy profiles at
respectively ![]() and
and ![]() .
.
To have a handle on this error along a profile, we have calculated
error envelopes for all our profiles based on their best-fitting
exponentials. The combined uncertainty caused by photon shot noise
from the sky and the galaxy, calculated for azimuthally averaged
![]() annuli, has been added in quadrature with a large-scale sky
flatness and subtraction error term set to a constant
annuli, has been added in quadrature with a large-scale sky
flatness and subtraction error term set to a constant ![]() of the
actual sky electron counts. The error term obtained this way has been
added or subtracted, respectively, from the intensity profiles
corresponding to exponential surface brightness profiles and then
converted to magnitudes to produce the upper and lower error
envelopes. These error envelopes are shown in Fig. 3
along with the observed and model profiles. The colour profile error
envelopes, shown in Fig. 4 as dotted lines, have been
calculated by using the error term as described above for each colour
and applying usual error formulae for logarithms and combining the
errors thus obtained for each colour by quadrature. It is to be noted
that the large scale fluctuation level of
of the
actual sky electron counts. The error term obtained this way has been
added or subtracted, respectively, from the intensity profiles
corresponding to exponential surface brightness profiles and then
converted to magnitudes to produce the upper and lower error
envelopes. These error envelopes are shown in Fig. 3
along with the observed and model profiles. The colour profile error
envelopes, shown in Fig. 4 as dotted lines, have been
calculated by using the error term as described above for each colour
and applying usual error formulae for logarithms and combining the
errors thus obtained for each colour by quadrature. It is to be noted
that the large scale fluctuation level of ![]() of the sky
background is an upper limit, most frames showing less variation,
i.e. these error estimates are rather conservative . The
calibration zero-point uncertainty is not included in the plots.
of the sky
background is an upper limit, most frames showing less variation,
i.e. these error estimates are rather conservative . The
calibration zero-point uncertainty is not included in the plots.
The errors on the profiles at low luminosity do not influence the
total magnitude to a large extent, but sources projected onto or near
the galaxies do. We masked out such objects, trying not to eliminate
HII regions from the galaxy. An overall assessment of our
photometric accuracy is provided by a comparison with external data.
In Fig. 5 photometry from this paper is compared to data
published in Schmidt & Boller (1992a). The
agreement is quite good, ![]() in the B
band.
in the B
band.
![\begin{figure}
\includegraphics [width=7.5cm]{ds8453fp.ps}\end{figure}](/articles/aas/full/1999/11/ds8453/Timg63.gif) |
Figure 5: Comparison between the photometry of the present paper and the data published in Schmidt & Boller (1992a) |
Copyright The European Southern Observatory (ESO)