

|
The stellar spectra were normalised and smoothed using a 3 pixel window, and classified following the criteria of [Walborn & Fitzpatrick (1990)]. We obtained thus reliable spectral types for 175 stars. This is fewer than the 231 slit spectra mentioned in Sect. 3 because many stars were observed more than once, while a few were discarded because the signal-to-noise was too low to classify them properly. The method we have used for background subtraction allows us to estimate if the features present in the stellar spectra are undoubtedly of stellar origin.
Figures 4 to 24 show the classified spectra grouped by similar spectral type. The neutral hydrogen lines, together with the nebular lines that showed problems throughout the background subtraction, have been left out of scale in order to enhance the weaker features relevant to the classification process.
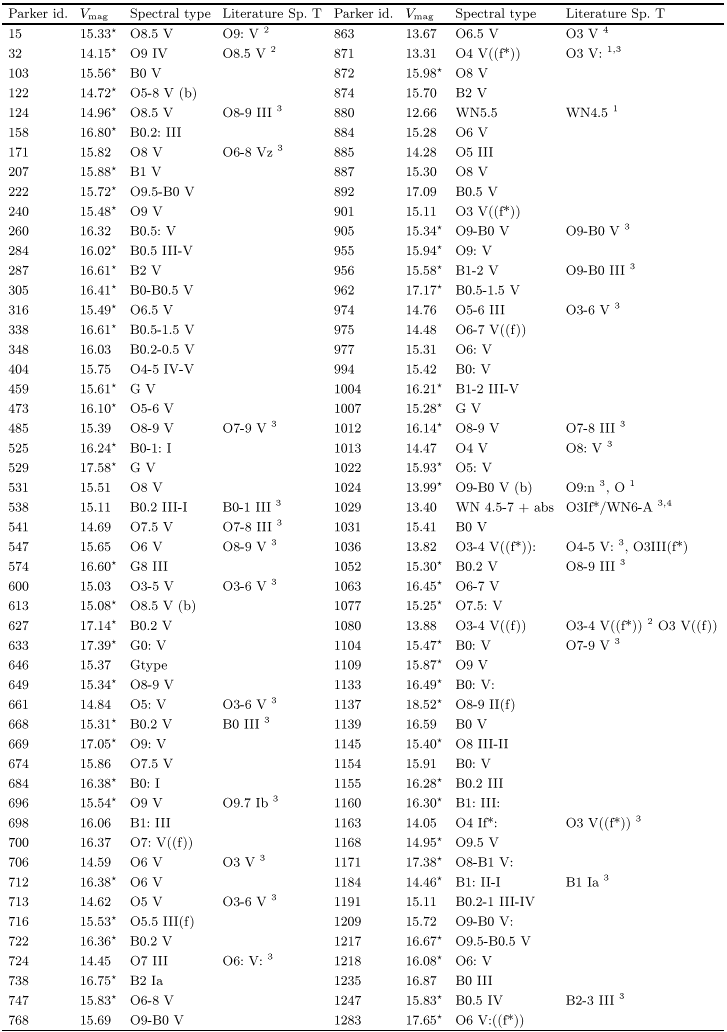
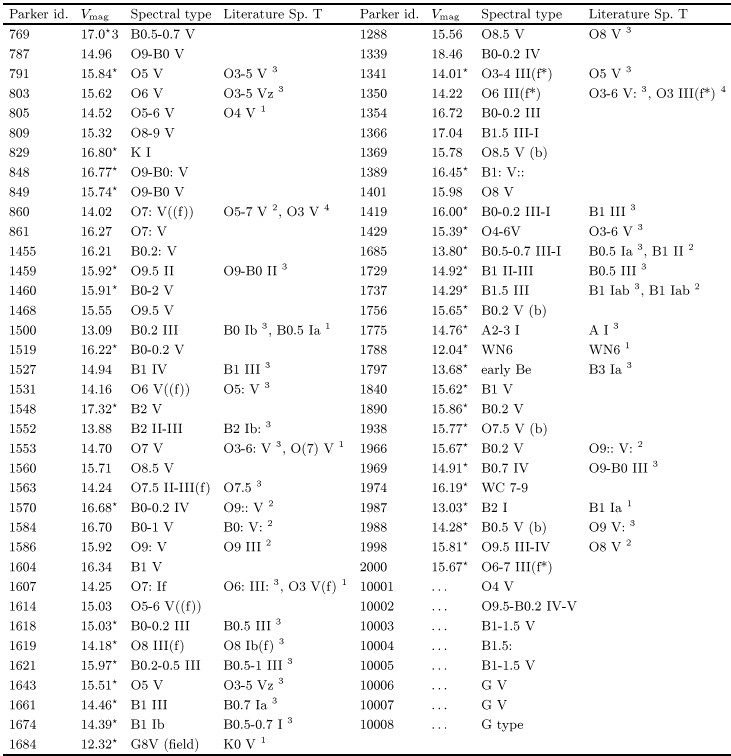
The resulting spectral types are presented in Table 1. The
stellar identifications in Col. 1 are those by
[Parker (1993)] (with the exception of a few stars which lie beyond the area covered by
his photometry, namely stars 10001 to 10008).
Column 2 shows the visual magnitude from Paper I when available
and [Parker (1993)]. The ones
from the latter are indicated with a "![]() " symbol. The discrepancies
between both photometries has already been discussed in Paper I.
Column 3 lists our spectral classification, and
Col. 4 indicates previous classification taken mostly from the compilation of
[Walborn & Blades (1997)] (hereafter WB). Table 2 lists the spectral
types available in the literature, for stars not observed by us but
which have been included in our analysis.
" symbol. The discrepancies
between both photometries has already been discussed in Paper I.
Column 3 lists our spectral classification, and
Col. 4 indicates previous classification taken mostly from the compilation of
[Walborn & Blades (1997)] (hereafter WB). Table 2 lists the spectral
types available in the literature, for stars not observed by us but
which have been included in our analysis.
A finding chart for our objects is included in Figs. 1 and 2, where slits have been drawn to scale, showing the corresponding identification number.
![\begin{figure}
\includegraphics [width=14cm]{H1193fig7.ps}
\end{figure}](/articles/aas/full/1999/10/h1193/Timg20.gif) |
Figure 7: Same as Fig. 4 for mid-O stars. The O6-8 type indicates weak HeII absorption lines, but with nebular contamination on HeI 4471 Å |
![\begin{figure}
\includegraphics [width=14cm]{H1193fig9.ps}
\includegraphics [width=14cm]{H1193fig10.ps}
\end{figure}](/articles/aas/full/1999/10/h1193/Timg22.gif) |
Figure 9:
Same as Fig. 4 for late O-type dwarf stars. As the intensity of the HeII
absorption lines diminishes,
the feature identified at 4026 Å is only due to HeI Figure 10: Same as Fig. 9 |
![\begin{figure}
\includegraphics [width=14cm]{H1193fig13.ps}
\includegraphics [width=14cm]{H1193fig14.ps}
\end{figure}](/articles/aas/full/1999/10/h1193/Timg24.gif) |
Figure 13:
Same as Fig. 4 for the early B-type dwarfs. Only traces of HeII
are detected. SiIII and SiIV,
used for classification, are identified here Figure 14: Same as Fig. 13 |
![\begin{figure}
\includegraphics [width=14cm]{H1193fig23.ps}
\includegraphics [width=14cm]{H1193fig24.ps}\end{figure}](/articles/aas/full/1999/10/h1193/Timg29.gif) |
Figure 23:
Spectral classification for O giant and Wolf-Rayet stars Figure 24: Spectral classification of B supergiant stars |
There are 70 stars in our sample with published spectral types, mostly from WB.
A comparison plot of both classifications is presented in Fig. 25,
where we plot the spectral types
from the literature against
our own spectral types.
The bars indicate the
uncertainty in the spectral classification using the following convention: an
O3-6 star appears in the Fig. 25 as an O4.5 type with a ![]() error bar in spectral class.
From the plot it can be seen that:
error bar in spectral class.
From the plot it can be seen that:
Our O-type classification was done using better quality data than the previous observations. The improvement comes mostly from our method for subtraction of nebular contamination, and also from a better S/N ratio. However, for the B-type stars the classification is more sensible to spectral resolution, which is slightly better in WB, than to S/N. These facts are relevant in the following discussion of the 9 discrepant cases.
![\begin{figure}
\includegraphics [width=8.8cm]{H1193fig25.ps}\end{figure}](/articles/aas/full/1999/10/h1193/Timg31.gif) |
Figure 25: Comparison between spectral classification described in this paper, and the one found in the literature. Square markers identify the comparison with Walborn & Blades (1997) (WB97) and [Parker (1993)]. Triangle markers indicate the comparison with spectral types in MH. Labelled points are discussed in the text |
There are six stars in common with the work of [Massey & Hunter (1998)] where they present spectral types for stars within the core of
the cluster obtained using the Faint Object Spectrograph (FOS)
(numbers 860, 863, 1029, 1036, 1080, 1350 in Table 1;
plotted in triangles in Fig. 25.)
The FOS observations were obtained through a 0.26''
diameter aperture which reduces the nebular contamination considerably,
making it negligible
for H and HeI lines.
From the ratio of slit areas
we estimate
that the nebular contamination in the FOS spectra is about 40 times smaller than in our
NTT observations.
On the other hand, there is a big difference in the
light collecting areas so, since the
exposure times are slightly larger for the NTT data, the overall S/N ratio
is significantly larger in our data. Furthermore, the Digicon detector of the
FOS is known to
introduce problems due to "dead" and noisy diodes.
The observational procedure, described by MH, shifts the spectra along 5
neighbouring diodes at a step of 1/4 diode, which means that a diode turned off
reduces the S/N ratio by a factor of
![]() , while a noisy diode introduces
spurious emission or absorption features that are 20 pixels wide.
In particular, at the
redshift of 30 Doradus, the HeI 4471 feature lies approximately in diode # 408.
According to
the information available in the FOS manual, diode # 409 is turned off and diode
# 410 is reported as possibly noisy, though still turned on. This reduces
considerably the S/N ratio in this region of the spectrum, which unfortunately
makes the
detection of weak HeI 4471 features rather difficult.
, while a noisy diode introduces
spurious emission or absorption features that are 20 pixels wide.
In particular, at the
redshift of 30 Doradus, the HeI 4471 feature lies approximately in diode # 408.
According to
the information available in the FOS manual, diode # 409 is turned off and diode
# 410 is reported as possibly noisy, though still turned on. This reduces
considerably the S/N ratio in this region of the spectrum, which unfortunately
makes the
detection of weak HeI 4471 features rather difficult.
By comparing the FOS intensities of the
H![]() and H
and H![]() absorption lines, which are free from nebular contamination in the FOS
data, with our NTT data, we can obtain an independent check of
the goodness of our nebular subtraction method. Below we present
the result of this comparison for the 3 stars for which we disagree with the classification
of MH.
absorption lines, which are free from nebular contamination in the FOS
data, with our NTT data, we can obtain an independent check of
the goodness of our nebular subtraction method. Below we present
the result of this comparison for the 3 stars for which we disagree with the classification
of MH.
Copyright The European Southern Observatory (ESO)