The cluster finding pipeline described in Paper II was applied to the
even, odd and paired galaxy catalogs, using the same parameters to
describe the cluster radial profile and luminosity function
(![]() ,
,
![]() and
and ![]() ,
,![]() ), the same SExtractor detection parameters
(
), the same SExtractor detection parameters
(![]() and
and ![]() corresponding to the area of a circle
with radius
corresponding to the area of a circle
with radius ![]() ),
and the same selection criteria (
),
and the same selection criteria (![]() ,
,![]() and
and ![]() ) described in that paper.
However, as discussed above, the cluster candidate catalog derived from
the even/odd galaxy catalogs was severely affected by spurious
candidates located near bright stars. These were subjectively rejected
after visual inspection of all detections. As expected, the use of
paired catalogs avoids all cases of cluster candidates that had been
detected in the vicinity of light trails and occasionally faint
satellite tracks. In addition new candidates are also found, probably
because of subtle changes in the background population. It is worth
emphasizing that visual inspection of these new candidates shows that
they are in general very robust. In order to take advantage of these new
detections the final cluster candidate list shown below is a
combination of all
) described in that paper.
However, as discussed above, the cluster candidate catalog derived from
the even/odd galaxy catalogs was severely affected by spurious
candidates located near bright stars. These were subjectively rejected
after visual inspection of all detections. As expected, the use of
paired catalogs avoids all cases of cluster candidates that had been
detected in the vicinity of light trails and occasionally faint
satellite tracks. In addition new candidates are also found, probably
because of subtle changes in the background population. It is worth
emphasizing that visual inspection of these new candidates shows that
they are in general very robust. In order to take advantage of these new
detections the final cluster candidate list shown below is a
combination of all ![]() detections identified in the three
galaxy catalogs.
detections identified in the three
galaxy catalogs.
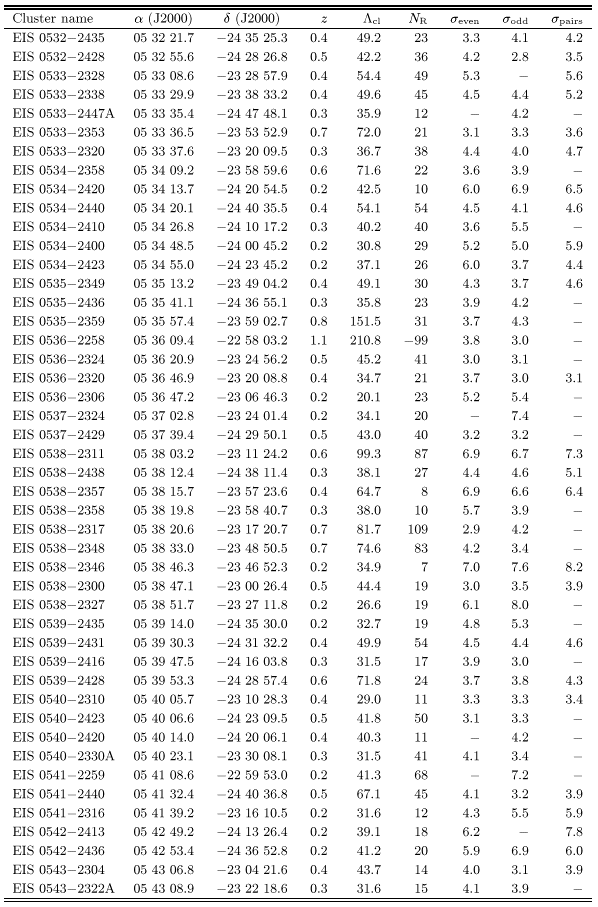
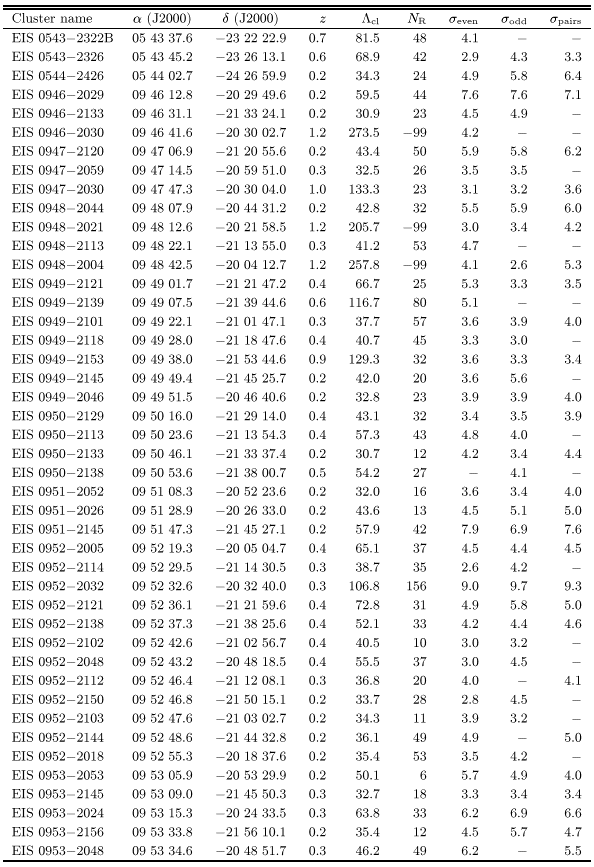
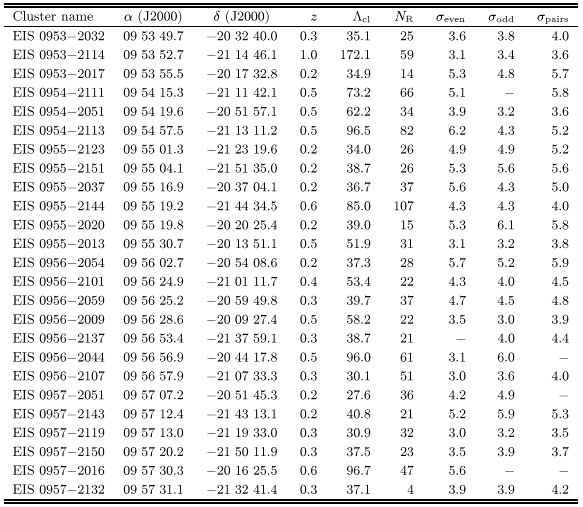
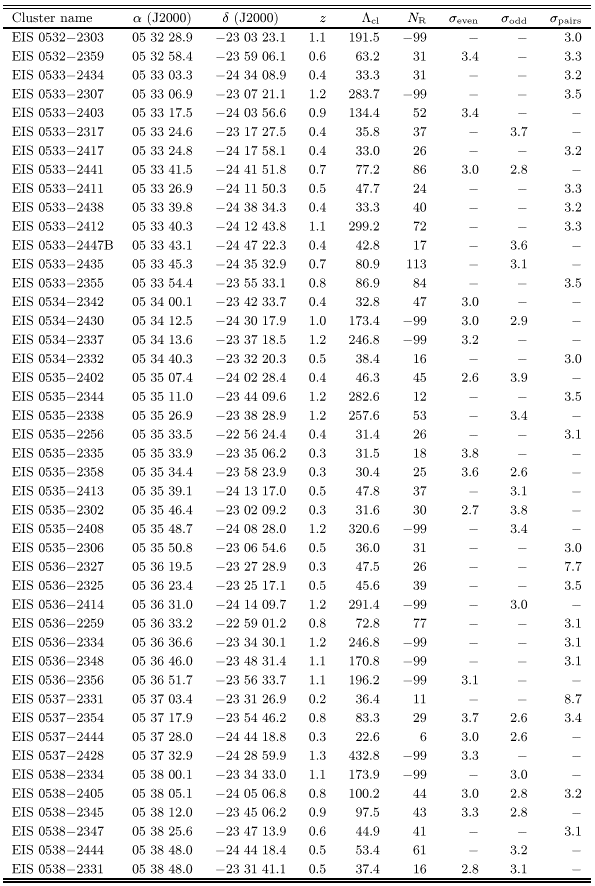
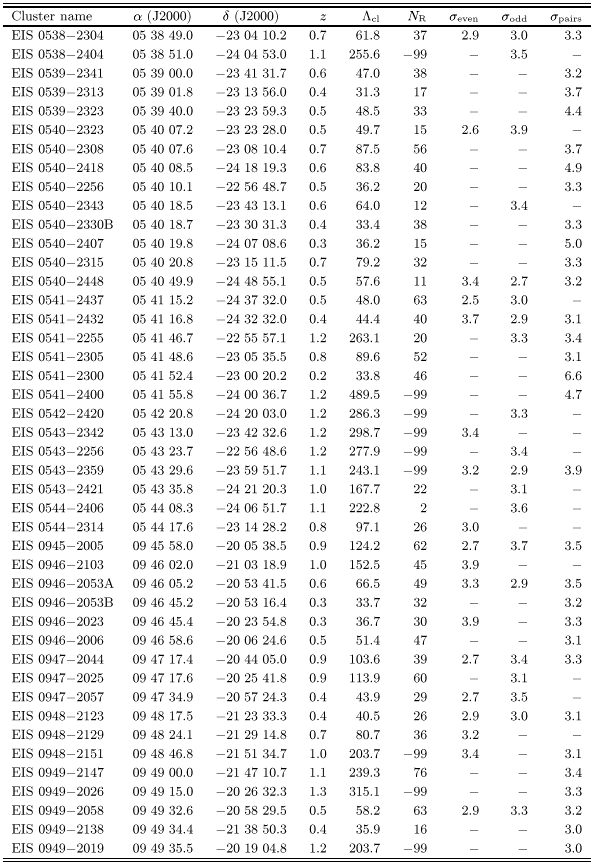
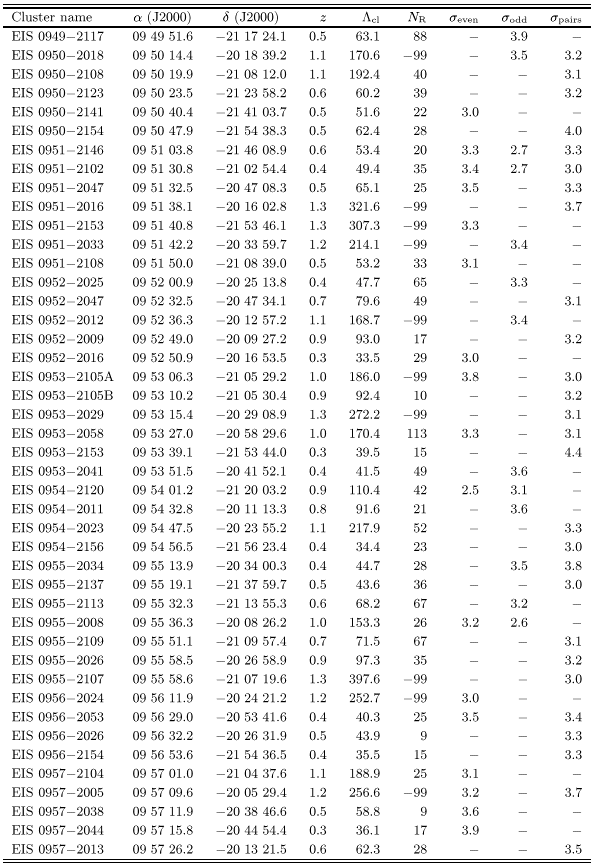
Table 1 lists 115 cluster candidates in patches C and
D detected either at 4![]() in one or at
in one or at ![]() in both
odd/even catalogs. These were the objects considered as "good''
candidates in Papers II and V. Note that 65% of them were also
detected using the paired catalog. Table 2 lists the
78 candidates which were detected at
in both
odd/even catalogs. These were the objects considered as "good''
candidates in Papers II and V. Note that 65% of them were also
detected using the paired catalog. Table 2 lists the
78 candidates which were detected at ![]() in only one of the
even/odd catalogs and in some cases at lower significance in the
other.
in only one of the
even/odd catalogs and in some cases at lower significance in the
other.
In Paper II the frequency of noise peaks in the cluster candidate
catalogs was estimated to be 0.4 per square degree for the ![]() detections and 4.6 per square degree for the
detections and 4.6 per square degree for the ![]() detections.
Therefore the contamination by spurious detections in the total sample
presented in Tables 1 and 2 is
expected to be
detections.
Therefore the contamination by spurious detections in the total sample
presented in Tables 1 and 2 is
expected to be ![]() , with a significantly smaller frequency if only
Table 1 is considered.
, with a significantly smaller frequency if only
Table 1 is considered.
All detections have been visually inspected and nearly all appear to be promising candidates, although the reliability of the low-redshift candidates is usually more difficult to evaluate. As pointed out above, candidates detected in the paired catalog are particularly encouraging. Furthermore, high-redshift clusters are more frequent in the paired catalog than in the odd/even catalogs. This probably happens because the galaxy pairing eliminates faint spurious objects. It should be pointed out that there are also cases where a cluster is detected in either one or both odd/even catalogs but it is not detected in the paired catalog. This is possibly due to more subtle effects in the background and noise properties of the Likelihood maps. In other cases, especially for the few candidates detected at relatively high significance in one set but not in the other, the center of the candidate cluster and/or the redshift estimate appear to be incorrect. This is most likely due to projection effects of clusters lying along the line-of-sight, which are not well resolved by the searching algorithm. Finally, note that in patches C and D about 85% of the "good'' candidates are detected in both the even and odd catalogs, in contrast to the 65% found in patches A and B. This better matching of detections is possibly due to the fact that the data for patches C and D are significantly more homogeneous than those of patches A and B.
Of the 248 candidates listed in Tables 1 and 2, 121 are in patch C and 127 in patch D, over an effective area of 5.3 and 5.5 square degrees, respectively. The implied number density of cluster candidates is about 23.1 per square degree, higher than the values found for patches A and B and by Postman et al. (1996) for their main sample. However, this density is quite similar to the one found by those authors for their extended sample, that includes less significant detections comparable to those listed here in Table 2. The discrepancy with the results obtained for patches A and B instead appears to be due mainly to the inclusion in the present sample of the detections in the paired catalog only.
The projected distribution of the cluster candidates over the two patches is shown in Fig. 1. As can be seen in this figure, the candidates appear to be distributed uniformly over the whole area of the patches, independently of their significance.
![\begin{figure}
\includegraphics [width=8cm]{8026f1.eps}\end{figure}](/articles/aas/full/1999/10/ds8026/img23.gif) |
Figure 1: The projected distributions for the cluster candidates detected in Patches C (upper panel) and D (lower panel). The filled circles mark the distributions for the "good'' candidates as defined in the text. In the distribution for patch C the region discarded from the analysis is indicated |
Figure 2 shows the distribution of estimated redshifts for
the combined sample of candidate clusters identified in patches C and
D. The median redshift for this sample is 0.5, which is comparable to
the value found by Postman et al. (1996), but larger than the value
found for Patch A (![]() , Paper II). The latter is probably
because the Patch A data are in general of worse quality than those
for Patches C and D, and therefore the distant clusters are not
detected.
, Paper II). The latter is probably
because the Patch A data are in general of worse quality than those
for Patches C and D, and therefore the distant clusters are not
detected.
![\begin{figure}
\includegraphics [width=7.5cm]{8026f2.eps}\end{figure}](/articles/aas/full/1999/10/ds8026/img25.gif) |
Figure 2: The redshift distribution for the cluster candidates detected in Patches C and D. The shaded area marks the distribution for the "good'' candidates as defined in the text. The dashed line shows the distribution for the candidates detected in the paired catalogs |
The total sample of EIS cluster candidates, obtained by combining the
detections in the four EIS-wide patches, consists of 302 objects
identified over an area of 14.4 square degrees, yielding a density of
21.1 per square degree. As can be seen in Fig. 3, the
range in estimated redshift covered by the total sample is ![]() , with a median value of
, with a median value of ![]() . Of course the properties
of the global sample resemble quite closely those described above for
the patches C and D only, since detections in these two patches amount
to
. Of course the properties
of the global sample resemble quite closely those described above for
the patches C and D only, since detections in these two patches amount
to ![]() of the total sample.
of the total sample.
![\begin{figure}
\includegraphics [width=8cm]{8026f3.eps}\end{figure}](/articles/aas/full/1999/10/ds8026/img31.gif) |
Figure 3:
The redshift distribution of the total sample of EIS clusters
(thin line) as presented in the present work and in Papers II and V in
total covering an area of |
Copyright The European Southern Observatory (ESO)