All 229 observations were made at the Cassegrain-focus of the Laboratório
Nacional de Astrofísica (LNA) 1.6 m reflector
(latitude = ![]() ) and they are distributed through 23 nights between 1993 and 1998.
The focal distance of the used configuration is 15.8 m which gives a scale of
) and they are distributed through 23 nights between 1993 and 1998.
The focal distance of the used configuration is 15.8 m which gives a scale of ![]() /mm at
the focal plane. The LNA latitude is well suited to observe Neptune since its present
declination range is around
/mm at
the focal plane. The LNA latitude is well suited to observe Neptune since its present
declination range is around ![]() . Therefore, we have for every night several
positions of Nereid near the zenith.
. Therefore, we have for every night several
positions of Nereid near the zenith.
Three CCDs were used in our observations. An EEV-05.20.0.202 which is an array with
![]() square pixels, each measuring 22.5
square pixels, each measuring 22.5 ![]() m which corresponds to 0
m which corresponds to 0![]() 293, and
two SI003AB CCDs with 1024
293, and
two SI003AB CCDs with 1024 ![]() 1024 square of side with 24
1024 square of side with 24 ![]() m (0
m (0![]() 312). No filter was
used and the exposure time was about 5 minutes. In Fig. 1 two of our frames of
Nereid are seen.
312). No filter was
used and the exposure time was about 5 minutes. In Fig. 1 two of our frames of
Nereid are seen.
The CCD frames with Nereid present some peculiar features. All images of Neptune and Triton are saturated. In particular, the image of Neptune saturates also some CCD columns (see Fig. 1b) and so its image is not measurable. On the other hand, Triton has their image strongly contaminated by the light scattered by Neptune. We have also that the brightest stars, which are suitable for the merging of the local catalog in a reference catalog, are also saturated. For Nereid, its images are very faint and sometimes just over the sky noise. Finally, the large variation of the distance between Neptune and Nereid gives many different positions of Nereid in the frames, which contributes to the non-uniformity of the reductions.
Therefore the reduction and the astrometric calibration of Nereid images are very difficult and the accuracy achieved is not always satisfactory. These problems will be considered in Sect. 4.
The ASTROL routines package (Colas & Serrau 1993) was employed to find the center of the satellite and stellar images. Each center was determined by a two-dimensional Gaussian fitting a small circular area around the image and where the background was removed by a second degree polynomial.
The errors upon the centering procedure were at 0![]() 03 for
Nereid and at 0
03 for
Nereid and at 0![]() 01 for the field stars. The errors upon the centering
of Triton are very difficult to estimate since the images are always
saturated.
01 for the field stars. The errors upon the centering
of Triton are very difficult to estimate since the images are always
saturated.
The astrometric calibration was performed using the method presented and tested for this satellite in Vieira Martins et al. (1996) (see also Assafin et al. 1997a, 1997b and 1997c). It consists on the setting of an astrometric catalogue for the stars on the CCD, using their images in the Digitized Sky Survey and the positions of nearby stars from the Guide Star Catalogue corrected by the PPM Catalog.
The RMS of the residuals in the secondary
catalog stars were about 0![]() 12 for a mean of 20 stars by frame. However
for some few frames the number of such stars is lesser than 5.
12 for a mean of 20 stars by frame. However
for some few frames the number of such stars is lesser than 5.
Depending on the elongation of Nereid, there are three types of frames:
We will see in Sect. 4 that these types of frames are important in the study of the accuracy of our results.
The images of Triton is always saturated and immersed into the light diffused by Neptune. However, when Triton and Nereid are in the same frame, we measured the center of Triton except for five images of 1993 where Triton entered into the saturated region, produced by the CCD charge bleeding due to the strong light of Neptune.
Therefore, we considered two set of positions. In the first one, we computed the right ascension and the declination of the satellite for all 229 observations. In the second set we take the positions of Nereid related to Triton for the 174 frames were the two satellites appear together and the Triton's image is measurable. The theoretical positions of Neptune were calculated using DE403 (Standish et al. 1995).
![\begin{figure}
\includegraphics [width=7.5cm]{ds8158f3.ps}\end{figure}](/articles/aas/full/1999/09/ds8158/img15.gif) |
Figure 2: Histogram of the CCD observations of Nereid with respect to time. Each bar corresponds to an observational mission |
![\begin{figure}
\includegraphics [width=8.5cm]{ds8158f4.ps}\end{figure}](/articles/aas/full/1999/09/ds8158/img16.gif) |
Figure 3: Fitted positions of Nereid from 1949 to 1998 on the elliptic orbit. The present CCD observations are represented by circles |
![\begin{figure}
\includegraphics [width=8.5cm]{ds8158f6.ps}\end{figure}](/articles/aas/full/1999/09/ds8158/img18.gif) |
Figure 5: The same as Fig. 4 but referred to the true anomaly. The circles correspond the our CCD observations |
We have the images of the type 1 for 4 images of 93, the first missions of 96, 97 and the first and second missions of 98. The mission of 94, the two missions of 95 and the second mission of 96 have images of type 2. For 5 images of the 93 mission, the third mission of 96 and the second of 97, we have images of type 3. The two image types in 1993 mission happens since, during the same night, we have frames where the image of Triton is measurable and others where it is not as explained above.
The distribution of all known positions on Nereid elliptic orbit is presented in Fig. 3. Our CCD observations are represented by circles and we can see that many of them were made at the periapsis region.
In Table 1 (accessible in electronic form) we list our positions of Nereid determined in equatorial coordinates. The data are presented in the following form: the first line gives the year, month and day and decimal fractions of UTC days, corresponding to the mean instant of the observation. In the next line we list the name of the satellite followed by the observed right ascension and the declination of Nereid. The reference system is referred to the equator and equinox of J2000.
In Table 2 (also accessible in electronic form) are presented our positions
of Nereid referred to Triton. The presentation of the data follows that of
Table 1 but the positions of Nereid are given by ![]() and
and ![]() ),
where
),
where ![]() and
and ![]() are the J2000 observed right
ascensions of Nereid and Triton and
are the J2000 observed right
ascensions of Nereid and Triton and ![]() and
and ![]() are their observed declinations.
are their observed declinations.
By backwards numerical integration in time (Le Guyader 1993) which consider
the barycenter of the Neptune - Triton system, the Sun and the eight other
planets into the same reference frame used in Veiga et al. (1996), we have
first computed the state vector of Nereid at Julian ephemeris date 2433007.5
(1949 April 1 at 0h TU). The starting constant values were here given by
Jacobson et al. (1991) (here after called JRT) and issued from the DE403
Ephemeris. At each step-size of 0.5 day, the solutions were computed in
Taylor series expansions of 19 derivatives with respect to time. Then, in
order to fit these new positions and velocities of Nereid we have solved,
by a least square method, a system of equations relating the unknown
variations of the initial conditions with quantities (O-C), which are
computed by 308 ground based observations and forwards numerical integration
in time, up to the Julian ephemeris date 2450990.5.
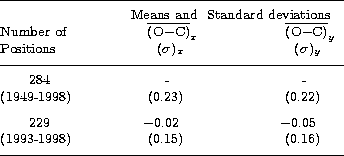
So after successive eliminating of 24 observations, the RMS for the remaining 284 (O-C)
were 0![]() 23 and 0
23 and 0![]() 22 for the right ascension and declinations respectively.
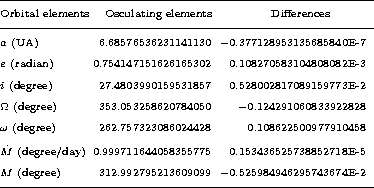
In Table 3 we present the fitted state vector of Nereid at Julian ephemeris
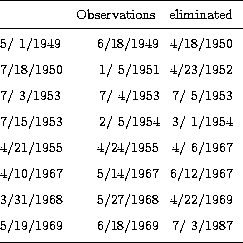
date 2433007.5, and in Table 4 are listed the 24 eliminated observations.
22 for the right ascension and declinations respectively.
In Table 3 we present the fitted state vector of Nereid at Julian ephemeris
date 2433007.5, and in Table 4 are listed the 24 eliminated observations.
 |
 |
 |
 |
 |
Copyright The European Southern Observatory (ESO)
![\begin{figure}
\includegraphics [width=5.2cm]{ds8158f1.ps}\end{figure}](/articles/aas/full/1999/09/ds8158/img8.gif)
![\begin{figure}
\includegraphics [width=7cm]{ds8158f2.ps}
\end{figure}](/articles/aas/full/1999/09/ds8158/img11.gif)
![\begin{figure}
\includegraphics [width=8.5cm]{ds8158f5.ps}\end{figure}](/articles/aas/full/1999/09/ds8158/img17.gif)