The light curves of YY Eri have shown a pattern of variable O'Connell effect with some asymmetry, that is, the system tending to be somewhat brighter at its maximum I (after the primary minimum) than the following peak (maximum II). An inverse O'Connell effect (maximum II brighter than maximum) can be seen in the observations of Müyesseroglu et al. (1990). A figuration of the variable O'Connell effect in V band for this system is shown in Fig. 4, which shows the observations carried out in 1958 by Purgathofer et al. (open circular points), in 1976 by Eaton (solid circular points), in 1984 by us (fork points), in 1988 by Müyesseroglu et al. (solid rhomb points), and in 1990 by Maceroni et al. (open rhomb points). For comparison, all light curves were reduced assuming that they have the same magnitude difference at the phase of 0.5. As shown in Fig. 4, the variation of the O'Connell effect of this system is very obvious and seems to be regular. The regularity of the variation becomes more obvious in Table 5, in which some parameters of the light curves for YY Eri are listed.
![\begin{figure}
\includegraphics [width=7.8cm]{ds1450f4.eps}\end{figure}](/articles/aas/full/1999/07/ds1450/img21.gif) |
Figure 4: Observed V light curves of YY Eri from 1958 to 1990. To compare, all light curves have been reduced to the same magnitude level at 0.50 of phase |
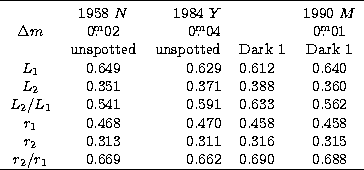
The photometric solutions of the light curves presented by different
authors reveal a constant radius ratio and variable luminosity ratio of the
two components for YY Eri. At least there are three sets of
solutions obtained by using Wilson-Devinney procedure in the literatures.
Some parameters of these solutions are listed in Table 6, where the
component radii, r1 and r2 are the geometrical mean of the polar,
side and back radii, which were computed ad hoc with the WD code when not
given in the original papers. L1 and L2 are relative luminosity
of the primary and secondary component in V band, respectively. Dark 1
indicates the solution with a cool spot on the surface of the primary
component. Column ![]() (=m(max. I) - m(max. II)) in
Table 6 gives a measure of the O'Connell effect (i.e. unequal
height of the maxima) in V color. The letter N, M or Y indicates
the solution by Nesci et al. (1986), by Maceroni et al.
(1994) or by us (the present paper), respectively. Comparing the
unspotted solution of Nesci et al. with our unspotted solution, the values
of r2/r1 from the two solutions are both equal to about 0.66, but
the value of L2/L1 from our solution is about 9% larger than that
of Nesci et al.'s solution. Moreover, we notice that the difference of the
O'Connell effect between the two light curves observed in 1984 and in 1958
is about 0.02 mag in V band. Comparing our solution spotted on the
primary component with that of Maceroni et al. also spotted on the primary
component, again the values of r2/r1 of the two solutions are both
equal to about 0.69, whilst L2/L1 from our solution is about 13%
larger than that of Maceroni et al. The difference of the measure of the
O'Connell effect between the two light curves observed in 1984 and in 1990
is about 0.03 mag in V band. Therefore, we conclude that the variation of
the O'Connell effect of YY Eri may be related with the variation of
L2/L1, but is not related with the variation of r2/r1. This
suggests that the variation of the O'Connell effect of this system is
probably related with activity of spots on one or both components.
(=m(max. I) - m(max. II)) in
Table 6 gives a measure of the O'Connell effect (i.e. unequal
height of the maxima) in V color. The letter N, M or Y indicates
the solution by Nesci et al. (1986), by Maceroni et al.
(1994) or by us (the present paper), respectively. Comparing the
unspotted solution of Nesci et al. with our unspotted solution, the values
of r2/r1 from the two solutions are both equal to about 0.66, but
the value of L2/L1 from our solution is about 9% larger than that
of Nesci et al.'s solution. Moreover, we notice that the difference of the
O'Connell effect between the two light curves observed in 1984 and in 1958
is about 0.02 mag in V band. Comparing our solution spotted on the
primary component with that of Maceroni et al. also spotted on the primary
component, again the values of r2/r1 of the two solutions are both
equal to about 0.69, whilst L2/L1 from our solution is about 13%
larger than that of Maceroni et al. The difference of the measure of the
O'Connell effect between the two light curves observed in 1984 and in 1990
is about 0.03 mag in V band. Therefore, we conclude that the variation of
the O'Connell effect of YY Eri may be related with the variation of
L2/L1, but is not related with the variation of r2/r1. This
suggests that the variation of the O'Connell effect of this system is
probably related with activity of spots on one or both components.
The authors would like to thank Dr. F. Van't Veer for his valuable comments and suggestions on the original version of this paper and Mr. Z. Zhang and Y. Zhang for their assistance in the observations. We would also like to express our gratitude for the support from the Chinese National Science Foundation.
Copyright The European Southern Observatory (ESO)