Section 3 on point sources implicitly
neglects the (more or less uniform) X-ray background which is superposed
on the source. This is justified because pile-up most strongly
affects bright sources, well above the background.
Quantitatively, for XMM/EPIC-MOS the background rate is expected to be
![]() cts/pixel/frame, to be compared to the
threshold for pile-up estimated in Sect. 3.2 to be
4 10-3 cts/pixel/frame at maximum. For the King PSF
appropriate to XMM/EPIC-MOS,
the local count rate for a source at threshold
crosses the background level at
cts/pixel/frame, to be compared to the
threshold for pile-up estimated in Sect. 3.2 to be
4 10-3 cts/pixel/frame at maximum. For the King PSF
appropriate to XMM/EPIC-MOS,
the local count rate for a source at threshold
crosses the background level at ![]() pixels distance.
Within this circle, the background totals about 10-2 cts/frame,
and the source about 0.5 cts/frame.
pixels distance.
Within this circle, the background totals about 10-2 cts/frame,
and the source about 0.5 cts/frame.
To take this into account properly, one would have to replace ![]() with
with ![]() throughout and stop the integration outwards
somewhere around
throughout and stop the integration outwards
somewhere around ![]() .
.
The pile-up process is a purely probabilistic effect which does
not depend on the energy of the photons, except through
the pattern distribution. But it affects the energy measurement
which is the sum of the energies of all photons which have contributed
to the measured event.
Section 3 implicitly assumes that the energy
band of the instrument is unbounded to high energies.
However X-ray instruments usually incorporate some kind of high energy
threshold above which events are discarded,
so that piled-up events with large total charge are not counted.
Therefore the measured count rate is actually lower than estimated
in Eq. (6).
Quantitatively, this is always a very small effect. A simulation
for XMM/EPIC-MOS with a relatively hard spectrum
(![]() cm-2, photon index 1.5)
shows that only a few % of piled-up events
get above the threshold. Since for monopixels the proportion
of piled-up events is itself around 1%, the effect is on the order
of a few 10-4.
cm-2, photon index 1.5)
shows that only a few % of piled-up events
get above the threshold. Since for monopixels the proportion
of piled-up events is itself around 1%, the effect is on the order
of a few 10-4.
It often happens that the telescope's attitude is not perfectly stable. It oscillates around the average pointing direction. What is important for the pile-up phenomenon (and for the spatial resolution) is what happens within a single frame. Therefore any attitude drift on time scales large compared to the frame integration time is irrelevant. The events may be accumulated in sky coordinates (i.e. corrected for the drifts) and pile-up analysed as if there were no drifts.
On the other hand, if non-negligible drifts occur during the frame integration time, then the PSF used for analysing the image (including the pile-up phenomenon) must be broadened to account for that. The bottom line is that pile-up depends on the effective PSF.
However the reasoning of Sect. 2 can be generalized
to non-uniform fluxes. For monopixels at least,
only the suppression term is affected
(the production term involves only one pixel).
![]() should be replaced by
should be replaced by ![]() (where g(x,y) is the normalized PSF).
Then instead of
(where g(x,y) is the normalized PSF).
Then instead of ![]() in (2-3)
one gets
in (2-3)
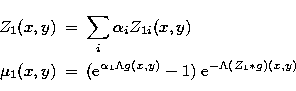
one gets ![]() where the sum bears on all patterns and for each pattern
on all pixels of the exclusion zone. This is actually the convolution
of g(x,y) with the exclusion masks Z1i(x,y) of Fig. 2
(the mask's integrals are the nji coefficients of Sect. 2.1).
Therefore
where the sum bears on all patterns and for each pattern
on all pixels of the exclusion zone. This is actually the convolution
of g(x,y) with the exclusion masks Z1i(x,y) of Fig. 2
(the mask's integrals are the nji coefficients of Sect. 2.1).
Therefore
 |
||
| (9) |
This leads in general to less flux loss at the center of the PSF
but more pile-up than predicted by (2-3).
For example, integrating (9) over space for a King PSF
with r0 = 0.6 pixels and ![]() (representative of the AXAF/ACIS),
and
(representative of the AXAF/ACIS),
and ![]() count/frame, leads to a flux loss of 37.8%
for monopixels and a pile-up rate of 4.6%
when the source is centered on a pixel (the least favourable case).
Equations (5) and (6) would have predicted
a flux loss of 52.5% and a pile-up rate of 1.6%.
For that PSF the pile-up rate reaches a maximum of 8% or so
at
count/frame, leads to a flux loss of 37.8%
for monopixels and a pile-up rate of 4.6%
when the source is centered on a pixel (the least favourable case).
Equations (5) and (6) would have predicted
a flux loss of 52.5% and a pile-up rate of 1.6%.
For that PSF the pile-up rate reaches a maximum of 8% or so
at ![]() photons/frame, after which it declines
to get back to values predicted by the simple model (5-6).
photons/frame, after which it declines
to get back to values predicted by the simple model (5-6).
For a PSF representative of the XMM/EPIC-MOS,
with ![]() photons/frame,
the error incurred by using (2) instead of (9)
is about 7% in the central pixel, and about 0.5% when
integrated over the whole spatial domain as in (6).
This justifies using the simpler formulae in that case (HWHM = 3.6 pixels).
photons/frame,
the error incurred by using (2) instead of (9)
is about 7% in the central pixel, and about 0.5% when
integrated over the whole spatial domain as in (6).
This justifies using the simpler formulae in that case (HWHM = 3.6 pixels).
In the general case, Eq. (2) may still be applied locally (at the pixel or few-pixel scale) to try and recover the true spatial distribution. However one is then hampered by the statistics, and care must be taken to estimate the errors properly in the heavily piled-up areas (the pile-up correction destroys the Poisson character). This problem is actually very similar to that of retrieving the PSF from real data, presented in Appendix C.2.
In some situations it may happen that true X-rays split over more than four pixels. For example this is the case for XMM/EPIC-MOS at high energy when an X-ray is absorbed in the field free region of the CCD. The charge is then collected over many pixels (up to several tens). This is not usually a severe problem because even though it affects a large (up to one half) fraction of high energy photons, pile-up depends on the overall pattern distribution (integrated over the source spectrum) which is dominated by low-energy photons.
However this can be taken into account perfectly.
These large patterns affect only the suppression terms
(such events are not collected, they are of poor quality).
It is thus enough to compute the exclusion areas for large patterns,
to be added to ![]() in (1) or Appendix A.
On the other hand it would be extremely tedious to include
in the formula coefficients for all possible shapes and sizes,
so reasonable approximations are in order.
As an example, if these charge patterns appear compact
(i.e. of minimal linear extension for a given area),
the exclusion areas for monopixel targets and secondary patterns
with N = 5, 6, 7, 8, 9 pixels are respectively
A = 19, 20, 23, 24, 25 pixels.
An approximate formula, valid to
in (1) or Appendix A.
On the other hand it would be extremely tedious to include
in the formula coefficients for all possible shapes and sizes,
so reasonable approximations are in order.
As an example, if these charge patterns appear compact
(i.e. of minimal linear extension for a given area),
the exclusion areas for monopixel targets and secondary patterns
with N = 5, 6, 7, 8, 9 pixels are respectively
A = 19, 20, 23, 24, 25 pixels.
An approximate formula, valid to ![]() 1 pixel up to N = 1000, is
1 pixel up to N = 1000, is
![]()
Copyright The European Southern Observatory (ESO)