![]() Samples
Samples
We have studied the behavior of 57 MK standards and of 137 stars signaled as having composite
spectra, on the basis of equivalent widths.
- Composite spectra
The sample of CS stars was selected, as for Paper II, from the list of Hynek (1938); some additional objects were taken from Markowitz (1969); Cowley (1973, 1976), Hoffleit & Jaschek (1982) and Stickland (1988).
We did observe 86 stars designed as or suspected to be CS; we have also reobserved 51 CS already taken with CARELEC, both to ensure a perfect fit and to supplement the material for some stars of Paper II which present problems.
- MK standards
We observed 57 standards stars; 40 of these had already been studied in Paper I and were reobserved to permit the calibration of AURELIE with respect to CARELEC. Seventeen new stars were included to study the lines MgI 8806 and FeI 8824. This complete sample is representative of stars of spectral types G, K and M and luminosity classes I, II, III and V.
The observational limits of our samples are V < 9.5
and ![]() .
.
![]() Observations
Observations
The observations were made at the 152 cm
telescope with the AURELIE spectrograph
(Gillet et al. 1994)
at a dispersion of 33 Å/mm. Five observational
runs were made in 1995 and 1996 and
permitted to secure 194 objects
(standards plus CS), usually with two spectra for each star.
At this dispersion one has access to 880 Å,
instead of the 400 Å available at the CARELEC
spectrograph. We have used a region of 500 Å
extending between 8370 and 8870 Å, because for
![]() Å the spectra are dominated by
strong telluric lines. The receiver for the AURELIE
spectrograph is a Thomson double bar (TH 7832) constituted by two lines of 2048 photodiodes of
Å the spectra are dominated by
strong telluric lines. The receiver for the AURELIE
spectrograph is a Thomson double bar (TH 7832) constituted by two lines of 2048 photodiodes of
![]() m,
each line (even and uneven pixels) being read by two lateral CCD's.
m,
each line (even and uneven pixels) being read by two lateral CCD's.
The treatment of spectra is here definitely simplified respect to CARELEC, since we have to deal only with unidimensional images. As with CARELEC a tungsten lamp has been used for flat field, and a neon spectrum for calibrations in wavelength. The normalisation of the spectra and the measurement of the equivalent widths has been made in a similar way to those made with CARELEC (see Paper I) with the help of the IHAP software available at the OHP.
![]() Calibrations CARELEC/AURELIE
Calibrations CARELEC/AURELIE
To calibrate the spectra obtained with
Aurelie with regard to those obtained with Carelec, we have
measured the equivalent widths of some
blends and lines selected over the length of the spectrum
for the 40 MK standards. We have chosen the blend
8468 Å, the CaII triplet (8498, 8542, 8662 Å),
FeI 8688 Å and the total absorption between
8390 and 8775 Å (TA).
The measurements carried out with the two spectrographs are given in Figs. 1-4; on these graphs we have also plotted the equivalent width's of the CS measured.
| Figure 1: Comparison of equivalent widths measured from CARELEC and AURELIE spectrographs for the 8468 Å blend, the Triplet of CaII, the FeI 8688 line and the Total Absorption between 8390 Å and 8775 Å. Filled squares: MK standards; open circles: composite spectra |
| Figure 2: Behaviour of the equivalent widths of the MgI 8806 and FeI 8824 lines versus R (correlated with the spectral type, see text) for MK standards. Open squares: supergiants; asterisks: bright giants; open circles: giants; dots: dwarfs |
| Figure 3: Behaviour of the MgI 8806/FeI 8824 and MgI 8806/FeI 8688 equivalent width ratios versus R (correlated with the spectral type, see text) for MK standards. Open squares: supergiants; asterisks: bright giants; open circles: giants; dots: dwarfs |
| Figure 4: Comparison of the Spectral Types (Sp T) and Luminosity Classes (Lumi.) for 51 composite spectra classified with both the CARELEC and AURELIE spectrographs. Sp T: G...1, K...2, M...3; Lumi.: Ia...0, Ib...1, II...2, III...3; numbers of the plots are weights |
We find that for the shorter wavelengths (blend 8468 and CaII triplet) the equivalent widths obtained with Aurelie are, in the mean, weaker than those measured with Carelec, whereas for the longer wavelengths (FeI 8688) and for the total absorption TA there is no significant difference.
A careful comparison of the spectra show effectively
that the lines observed with Aurelie are less
deep than when observed with Carelec.
This translates into a correction of the sum of the three
equivalent widths of the CaII lines by an
average correction of 0.5 Å, i.e. a 3 to 7%
correction of the
equivalent width. On the other side, the
continuous background of the spectrum is sligthly inferior
to the pseudocontinuum at the longer wavelengths
(essentially for ![]() Å) because we had to
adjust it over a longer wavelength range
than for the Carelec spectra and these two effects seem to
compensate for TA and FeI 8688.
Å) because we had to
adjust it over a longer wavelength range
than for the Carelec spectra and these two effects seem to
compensate for TA and FeI 8688.
We still compare in Sect. 3 the classifications made with material from the two spectrographs to see if with all corrections made there remains still a systematic effect.
![]() Classification criteria
Classification criteria
The classification of the 115 objects which present a cool stellar
spectrum (G, K or M) in the near
infrared has been carried out using the same
criteria defined in Paper I and using the same technique
as described in Paper II. But since the zone
observable with Aurelie is larger than the zone
observable with Carelec, we have been able
to study with the help of the 57 MK standards the
behavior of two supplementary intense
lines, MgI 8806 and FeI 8824.
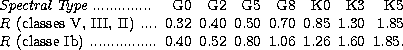
We have found in Paper I that a relation exists between the spectral type and the ratio of the central depths (R) of the neighbouring lines TiI 8683 and FeI 8679.
The mean relation was as follows:
We have therefore used this ratio R instead of the spectral type (assumed unknown for the CS) for the study of the behaviour of the lines MgI 8806 and FeI 8824: both lines present a positive luminosity effect (see Fig. 2). We have also considered the ratio of the equivalent widths of MgI 8806 and FeI 8688, as well as the ratio MgI 8806/FeI 8824. These two relations present a negative luminosity effect and permit a separation of giants and supergiants (Fig. 3). Dwarfs figure also on these graphs, in spite of their small number; they seem to behave like giants.
Copyright The European Southern Observatory (ESO)