Note that the folded curves match very well in the inner ![]() 20'', while
the curve along the North side suffer from the presence of the interaction
with NGC 127. The South side has a short extension because the RC
is extracted from the off-centered spectrum of the first night. The
spectrum of the second night (much more noisy) does not extend far out
Southwards.
20'', while
the curve along the North side suffer from the presence of the interaction
with NGC 127. The South side has a short extension because the RC
is extracted from the off-centered spectrum of the first night. The
spectrum of the second night (much more noisy) does not extend far out
Southwards.
The RC is very steep in the central region: at a distance
of 5'' from the center along the major axis the rotation velocity is
already 100 km s-1.
In BC77 the RC grows more slowly in the range ![]() , while in our
measurements the velocity increases outside 50'' up to a value of
, while in our
measurements the velocity increases outside 50'' up to a value of ![]() 350
km s-1 in the North direction.
350
km s-1 in the North direction.
In NGC 128 we do not see in the RC the characteristic "figure-of-eight'' feature, neither for the stellar or the gaseous component. Here the gas is counter-rotating and we have an X-shaped RC (see Sect. 3.2). According to Friedli & Udry (1993) and Emsellem & Arsenault (1997) the counter-rotating gas is tracing the anomaouls orbits existent in a tumbling triaxial potential.
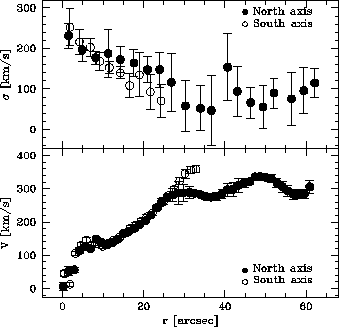 |
Figure 5: Upper panel: The folded velocity dispersion profiles along the major axis of NGC 128. Bottom panel: The folded RCs along the major axis. The South and North axes are indicated by open and filled circles respectively |
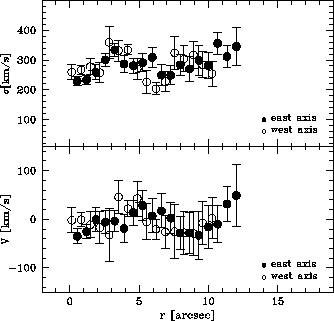 |
Figure 6: Upper panel: The folded minor axis velocity dispersion profiles of NGC 128. Bottom panel: The folded minor axis RCs. Open and filled circles indicate the East and West side respectively |
The folded RC along the minor axis of the galaxy is shown in
the bottom panel of Fig. 6.
The curve along the minor axis is less extended since
beyond ![]() 15'' the spectra reach the level of the sky surface brightness
and the errors become larger.
There is a hint of a non-zero velocity pattern along the minor axis
suggested by the occurrence of a maximum and of a minimum velocity at
symmetric places along the two sides opposite to the center.
If this behaviour will be confirmed by future data,
the presence of a small ring of stars (remnants of a polar ring?) can be
suspected.
15'' the spectra reach the level of the sky surface brightness
and the errors become larger.
There is a hint of a non-zero velocity pattern along the minor axis
suggested by the occurrence of a maximum and of a minimum velocity at
symmetric places along the two sides opposite to the center.
If this behaviour will be confirmed by future data,
the presence of a small ring of stars (remnants of a polar ring?) can be
suspected.
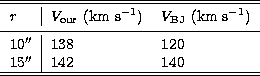
A number of off-centered spectra of NGC 128, along directions parallel and orthogonal to the main axes, have been obtained by B. Jarvis (private communication). We list the Jarvis' logbook in Table 2 and we plot the corresponding RCs in Fig. 7. The agreement with our data is quite good. The comparison of the measured velocities at a given distance r along the RC is shown in Table 3.
Such spectra show that the cylindrical rotation
is observed up to 20'' (![]() 5.4 kpc). The major axis off-set RCs
are also quite similar to our curve, differing for a smaller gradient only.
5.4 kpc). The major axis off-set RCs
are also quite similar to our curve, differing for a smaller gradient only.
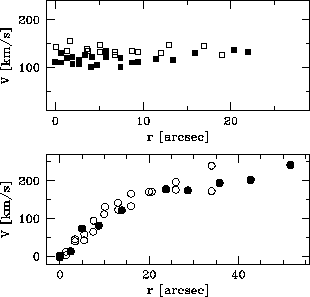 |
Figure 7: Upper panel: The RCs of NGC 128 along cuts perpendicular to the major axis. Filled square mark the RC at r=10''. Open square at r=15''. Bottom panel: The RCs along cuts parallel to the major axis: filled circles (r=4''), open circles (r=8'') |
The upper panel of Fig. 6 shows the folded minor axis velocity
dispersion (VD) profile.
The central value is around 220-240 km s-1.
Note the increase of ![]() 100 km s-1 in the inner 3'' and the wave-shape
which keeps the velocity dispersion to an high level out to the last
measurable point.
100 km s-1 in the inner 3'' and the wave-shape
which keeps the velocity dispersion to an high level out to the last
measurable point.
The folded VD profile along the major axis is shown in
Fig. 5 (upper panel). The shape is that characteristic of the
early-type galaxies, with a bulge dominated region where the velocity
dispersion decreases, and a disk dominated part, where the velocity remains
appromimately constant.
It is interesting to note the asymmetry in the VD profile
at ![]() 40'' in correspondence of the arm of NGC 127.
40'' in correspondence of the arm of NGC 127.
In Fig. 8 together with the unfolded RC obtained
from the absorption lines, we plotted the behaviour of the gas component
resulting from the emission lines.
We took the peak of a Gaussian curve, fitted to the emission lines in each row
of the spectra, as a measure of the rotational velocity of the gas.
It appears a clear counter-rotating gas component which extends up to
![]() 8'' (2.2 kpc) around the nucleus.
The gas seems to have the same gradient of the stellar component. In the first
4'' around the nucleus the rotation velocity increases up to
8'' (2.2 kpc) around the nucleus.
The gas seems to have the same gradient of the stellar component. In the first
4'' around the nucleus the rotation velocity increases up to ![]() km s-1. This behaviour is in agreement with the velocity field
derived by Emsellem & Arsenault (1997) with TIGER. They found that
the gas and the stellar velocity at 3.5'' along the major axis is
km s-1. This behaviour is in agreement with the velocity field
derived by Emsellem & Arsenault (1997) with TIGER. They found that
the gas and the stellar velocity at 3.5'' along the major axis is ![]() km s-1.
km s-1.
 |
Figure 8:
Upper panel: The gas velocity dispersion along the major axis
of NGC 128 (filled circles) compared to the inner star velocity dispersion
(open circles) averaged over the two semiaxes.
The error bars, non plotted here, are of |
Unfortunately the S/N ratio is not high enough to follow the gas emission at larger distances. We also do not observe the "figure-of-eight'' in the rotation curve which is a strong signature of a barred potential (Kuijken & Merrifield 1995).
The velocity dispersion of the gas is more difficult to evaluate.
We derived an approximate value by correcting the sigma of the Gaussian, used
to fit the emission lines, for the instrumental dispersion through the relation:
![]() . The velocity dispersion
is nearly constant at
. The velocity dispersion
is nearly constant at ![]() 175 km s-1 within the central 5''.
This is only
175 km s-1 within the central 5''.
This is only ![]() 55 km s-1 lower than the central stellar velocity dispersion.
A possible explanation for this high value is that the gas is not
in equilibrium yet.
55 km s-1 lower than the central stellar velocity dispersion.
A possible explanation for this high value is that the gas is not
in equilibrium yet.
The velocity field of NGC 128 derived by the CIGALE data is plotted
in Fig. 9. It is well consistent with a disk-like gas
component. The rotational velocity is positive along the SE direction and
negative in the NW.
The major axis of the H![]() disk is observed to extend up to
disk is observed to extend up to ![]() 25'' and is
approximately oriented at a position angle PA
25'' and is
approximately oriented at a position angle PA ![]()
![]() . The PA
decreases from the center (PA
. The PA
decreases from the center (PA ![]()
![]() ) to the outer parts (PA
) to the outer parts (PA
![]()
![]() ).
).
CIGALE is in poor agreement with the long slit spectroscopic data
(Fig. 8). The gradient of the RC, the maximum rotational velocity,
and the systemic velocity of the galaxy (greater by ![]() 90 km s-1) do not
match the EFOSC data. The discrepancy is probably due to the loss of
resolution caused by the binning of the CIGALE data. On the other hand the
agreement is fair with the photometric observations, despite the lower
resolution and the bad seeing condition. The extension and the PA of the gas
disk component are similar.
90 km s-1) do not
match the EFOSC data. The discrepancy is probably due to the loss of
resolution caused by the binning of the CIGALE data. On the other hand the
agreement is fair with the photometric observations, despite the lower
resolution and the bad seeing condition. The extension and the PA of the gas
disk component are similar.
From the 2D velocity field of the gas, following Plana & Boulesteix
(1996),
we derived an inclination for the disk
of ![]() 50
50![]() which is in fair agreement with the value of
which is in fair agreement with the value of
![]() 60
60![]() computed from the apparent flattening of the H
computed from the apparent flattening of the H![]() image (see
Sect. 5).
image (see
Sect. 5).
Copyright The European Southern Observatory (ESO)
![\begin{figure}
\includegraphics [height=8cm]{ds7507f9.ps}\end{figure}](/articles/aas/full/1999/03/ds7507/img54.gif)