Papers I and II constructed a large sample of radio-loud X-ray objects from
the correlation of the RASS survey with the 5 GHz Green Bank survey. The
resulting RGB sample is an order of magnitude less sensitive in both spectral
bands than the NEP sample obtained here, although it covers a much larger area
of the sky. The relationship between the two surveys is illustrated in
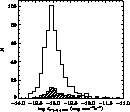
Fig. 6; the RGB histograms are drawn from Fig. 4 of Paper
II. Two features can be noted. First, while the X-ray fluxes of the NEP
sources are confined to about 1.5 orders of magnitude![]() , the radio flux densities are spread over
3 orders of magnitude. Any correlations between the quantities must
show considerable scatter. Second, no bimodality is seen in the radio
flux density distribution as is seen, for example, in the
optically-selected quasar samples of Strittmatter et al.(1980)
and Kellerman et al.(1989). This result is consistent with the
findings of Papers I and II which, however, did not significantly sample the
faint end of the radio-loud AGN population in either radio luminosity or the
ratio of radio-to-optical emission. Bimodality is evident in the NEP sample
in the distribution of the ratio of radio-to-optical emission, as
measured by the radio-to-optical spectral index,
, the radio flux densities are spread over
3 orders of magnitude. Any correlations between the quantities must
show considerable scatter. Second, no bimodality is seen in the radio
flux density distribution as is seen, for example, in the
optically-selected quasar samples of Strittmatter et al.(1980)
and Kellerman et al.(1989). This result is consistent with the
findings of Papers I and II which, however, did not significantly sample the
faint end of the radio-loud AGN population in either radio luminosity or the
ratio of radio-to-optical emission. Bimodality is evident in the NEP sample
in the distribution of the ratio of radio-to-optical emission, as
measured by the radio-to-optical spectral index, ![]() . As
discussed in the next section, the observed bimodality is consistent
with optically-selected quasar samples (e.g. Kellerman et al.1989,
1994, and Stocke et al.1992) and the X-ray-selected AGN
sample of Della Ceca et al.(1994).
. As
discussed in the next section, the observed bimodality is consistent
with optically-selected quasar samples (e.g. Kellerman et al.1989,
1994, and Stocke et al.1992) and the X-ray-selected AGN
sample of Della Ceca et al.(1994).
 |
Figure 7:
X-ray flux distribution of all the NEP sources in the inner |
Figure 7 shows the integrated 0.1 - 2.4 keV flux
distribution of all RASS sources in the central 3![]() 3
3![]() field of the NEP and the distribution of the radio-detected
subgroup. The radio-loud group has a slightly higher average X-ray
flux than the parent population, but radio-loud sources are found at
all X-ray flux levels. At the higher flux levels of the RGB samples,
a similar uniform distribution of radio-loud objects is seen (Paper I,
Fig. 6). The absolute detection rate in the NEP field is similar to
that of other deep X-ray observations (de Ruiter et al.1994;
de Ruiter et al.1997; Warwick
& Barber 1992) and considerably higher than for the RGB survey
(Papers I and II).
field of the NEP and the distribution of the radio-detected
subgroup. The radio-loud group has a slightly higher average X-ray
flux than the parent population, but radio-loud sources are found at
all X-ray flux levels. At the higher flux levels of the RGB samples,
a similar uniform distribution of radio-loud objects is seen (Paper I,
Fig. 6). The absolute detection rate in the NEP field is similar to
that of other deep X-ray observations (de Ruiter et al.1994;
de Ruiter et al.1997; Warwick
& Barber 1992) and considerably higher than for the RGB survey
(Papers I and II).
The broad-band ![]() color-color diagram has
been extensively used to display broad-band spectral energy distributions
and to classify extragalactic objects. The radio-to-optical index is
defined as
color-color diagram has
been extensively used to display broad-band spectral energy distributions
and to classify extragalactic objects. The radio-to-optical index is
defined as ![]()
![]()
![]() and the optical-to-X-ray index as
and the optical-to-X-ray index as
![]()
![]() .Here we use the radio fluxes at
.Here we use the radio fluxes at ![]() GHz,
the optical data at 4500 Å and the X-ray data at 2 keV.
While it has been widely asserted that different classes of objects
occupy distinct locations in this diagram, we note that the boundaries
can become less distinct as surveys become deeper in all bands (see
Fig. 10 of Paper II). Nonetheless, the diagram is an effective tool
for examining the spectral energy distributions of objects without
redshifts such as the NEP population discussed here.
GHz,
the optical data at 4500 Å and the X-ray data at 2 keV.
While it has been widely asserted that different classes of objects
occupy distinct locations in this diagram, we note that the boundaries
can become less distinct as surveys become deeper in all bands (see
Fig. 10 of Paper II). Nonetheless, the diagram is an effective tool
for examining the spectral energy distributions of objects without
redshifts such as the NEP population discussed here.
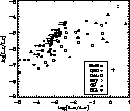
The ![]() diagram for the 74 sources in Tables
1 and 2 is shown in Fig. 8. It was constructed in a
similar manner to Fig. 10 in Paper II with the following exception. In
cases where the radio source appears to be multiple but the peaks were
individually cataloged in Kollgaard et al.(1994), only the
integrated flux density of the dominant component is used. The monochromatic
X-ray fluxes at 2 keV were computed from the observed count rate assuming a
typical power law photon index
diagram for the 74 sources in Tables
1 and 2 is shown in Fig. 8. It was constructed in a
similar manner to Fig. 10 in Paper II with the following exception. In
cases where the radio source appears to be multiple but the peaks were
individually cataloged in Kollgaard et al.(1994), only the
integrated flux density of the dominant component is used. The monochromatic
X-ray fluxes at 2 keV were computed from the observed count rate assuming a
typical power law photon index ![]() and absorption by the
Galactic neutral hydrogen column density in the direction
to the source. Optical magnitudes are primarily
and absorption by the
Galactic neutral hydrogen column density in the direction
to the source. Optical magnitudes are primarily ![]() -magnitudes from
the POSS-II plates and, as most objects lack redshift information, no
K-corrections are applied. The optically identified objects are
denoted by different symbols as given in the insert. Sources labelled
"No ID'' include those identified with faint sources classified as
unresolved by COSMOS or the APM. The cross indicates the ranges of
the indices corresponding to an optical error of
-magnitudes from
the POSS-II plates and, as most objects lack redshift information, no
K-corrections are applied. The optically identified objects are
denoted by different symbols as given in the insert. Sources labelled
"No ID'' include those identified with faint sources classified as
unresolved by COSMOS or the APM. The cross indicates the ranges of
the indices corresponding to an optical error of ![]() magnitude.
magnitude.
The bulk of the objects are found along the diagonal swath from
high-![]() and low-
and low-![]() to low-
to low-![]() and high-
and high-![]() . This swath is the region generally occupied by
radio-loud quasars and blazars (see Fig. 9 in Paper I).
Only four of the objects in Tables 1 and 2 are spectroscopically
identified as quasars and one is the well known BL Lac object S5 1749+70.
We therefore predict that most of the remaining objects are quasars or
related species such as flat spectrum radio sources
(upper left of the
. This swath is the region generally occupied by
radio-loud quasars and blazars (see Fig. 9 in Paper I).
Only four of the objects in Tables 1 and 2 are spectroscopically
identified as quasars and one is the well known BL Lac object S5 1749+70.
We therefore predict that most of the remaining objects are quasars or
related species such as flat spectrum radio sources
(upper left of the ![]() diagram), BL Lac
objects (throughout most of the swath; Laurent-Muehleisen et al.
1998), and Seyfert galaxies (lower right of the
diagram), BL Lac
objects (throughout most of the swath; Laurent-Muehleisen et al.
1998), and Seyfert galaxies (lower right of the ![]() diagram).
diagram).
A considerable fraction, ![]() , of the RASS-VLA sources do
not have optical counterparts brighter than B = 22.5. These are
indicated by circles with arrows pointed toward the upper left of the
, of the RASS-VLA sources do
not have optical counterparts brighter than B = 22.5. These are
indicated by circles with arrows pointed toward the upper left of the
![]() diagram. Many of these have X-ray
fluxes above
diagram. Many of these have X-ray
fluxes above ![]() erg s-1 cm-2 and thus do not
represent the large population of extremely faint sources thought
to constitute a significant fraction of the X-ray background
radiation. Those that lie in the middle or lower-right portion of the
diagram are likely to be normal quasars. But those lying in the upper left
portion have unusual spectral energy distributions with
erg s-1 cm-2 and thus do not
represent the large population of extremely faint sources thought
to constitute a significant fraction of the X-ray background
radiation. Those that lie in the middle or lower-right portion of the
diagram are likely to be normal quasars. But those lying in the upper left
portion have unusual spectral energy distributions with ![]() or even inverted spectra with
or even inverted spectra with ![]() . These sources can arise in three plausible ways: (a) they
are distant clusters whose X-ray emission is elevated due to an intra
cluster medium; (b) they are members of a subclass of optically-quiet
quasars or red quasars (e.g. Webster et al.1995;
Kollgaard et al.1995); or (c) they are spurious X-ray/radio
correlations. Option (c) is likely correct for those sources with very weak
radio emission, but over half (11 out of 21, see Fig. 11)
have S1.5 > 5 mJy and almost a third have S1.5 > 10 mJy, for which
spurious coincidences are unlikely. It is unclear whether the quasars in
option (b) constitute a rare or a major class of AGN. We looked at the
three most radio-bright NEP examples in a search for
optically-quiet quasars (Kollgaard et al.1995) and concluded
that they were more or less typical radio galaxies.
. These sources can arise in three plausible ways: (a) they
are distant clusters whose X-ray emission is elevated due to an intra
cluster medium; (b) they are members of a subclass of optically-quiet
quasars or red quasars (e.g. Webster et al.1995;
Kollgaard et al.1995); or (c) they are spurious X-ray/radio
correlations. Option (c) is likely correct for those sources with very weak
radio emission, but over half (11 out of 21, see Fig. 11)
have S1.5 > 5 mJy and almost a third have S1.5 > 10 mJy, for which
spurious coincidences are unlikely. It is unclear whether the quasars in
option (b) constitute a rare or a major class of AGN. We looked at the
three most radio-bright NEP examples in a search for
optically-quiet quasars (Kollgaard et al.1995) and concluded
that they were more or less typical radio galaxies.
The source 1747.2+6532
in the upper left in Fig. 8 at
![]() 0.78 is identified as 4C+65.22.
Lacy et al.(1993) mark it as "Q?" based on CCD observations.
Kollgaard et al.(1995) argue that 4C+65.22 is not a quasar, but
a radio galaxy, based on the two-component radio morphology at
8.4 GHz, associated spectral indices, and marginally-resolved
optical (R = 21.2 mag) image. It is undetected on the blue POSS II plate.
However, its position in the diagram, and even more that in the
flux-ratio plot (Fig. 10) where it is found close to left boundary,
at
0.78 is identified as 4C+65.22.
Lacy et al.(1993) mark it as "Q?" based on CCD observations.
Kollgaard et al.(1995) argue that 4C+65.22 is not a quasar, but
a radio galaxy, based on the two-component radio morphology at
8.4 GHz, associated spectral indices, and marginally-resolved
optical (R = 21.2 mag) image. It is undetected on the blue POSS II plate.
However, its position in the diagram, and even more that in the
flux-ratio plot (Fig. 10) where it is found close to left boundary,
at ![]()
![]() , would be very unusual for a galaxy
and thus the object may be a quasar instead.
The RASS-VLA source 1743.4+6342 which we classify as a group/cluster
occupies an extreme position in the diagram as well, and it may be
spurious in some sense. The radio source, also known as
8C 1743+637, arises from a faint galaxy behind the cluster Abell 2280
(Lacy et al.1993), while the X-ray emission is likely due to
the Abell cluster's gaseous medium. In any case, the extended X-ray RASS
source represents the detection of a galaxy grouping.
, would be very unusual for a galaxy
and thus the object may be a quasar instead.
The RASS-VLA source 1743.4+6342 which we classify as a group/cluster
occupies an extreme position in the diagram as well, and it may be
spurious in some sense. The radio source, also known as
8C 1743+637, arises from a faint galaxy behind the cluster Abell 2280
(Lacy et al.1993), while the X-ray emission is likely due to
the Abell cluster's gaseous medium. In any case, the extended X-ray RASS
source represents the detection of a galaxy grouping.
The lower right region of the diagram, which is usually populated by optically
prominent galaxies with low X-ray and radio emission, remains relatively
empty. We suggest that another order of magnitude in X-ray sensitivity is
needed before normal spiral galaxies are commonly found in all-sky surveys.
Instead, we find optical counterparts that are morphologically classified as
galaxies all along the swath occupied in the ![]() diagram. This is equivalent to the statement that galaxy
magnitudes are roughly uniformly distributed over the range
diagram. This is equivalent to the statement that galaxy
magnitudes are roughly uniformly distributed over the range ![]() . These objects include two IRAS-selected Seyfert 1 galaxies at
. These objects include two IRAS-selected Seyfert 1 galaxies at ![]() , a nearby Seyfert 2 galaxy at
, a nearby Seyfert 2 galaxy at ![]() , and several
distant unstudied (presumably elliptical) radio galaxies. In the latter
cases, the X-ray emission may arise either from the active nucleus or from a
surrounding intracluster medium.
, and several
distant unstudied (presumably elliptical) radio galaxies. In the latter
cases, the X-ray emission may arise either from the active nucleus or from a
surrounding intracluster medium.
Finally, we note that the galaxy groups and clusters are spread throughout the
diagram, illustrating the lack of tight correlations between optical, radio and
X-ray luminosities from these objects (Burns et al.1994). The
![]() diagram is thus a poor diagnostic tool
for discriminating groups and clusters from AGN.
diagram is thus a poor diagnostic tool
for discriminating groups and clusters from AGN.
We use the radio-to-optical spectral index, ![]() , to
analyze the NEP sample for evidence of the apparent dichotomy between
radio-quiet and radio-loud AGN. Both
, to
analyze the NEP sample for evidence of the apparent dichotomy between
radio-quiet and radio-loud AGN. Both ![]() and its
equivalent, the ratio of radio to optical flux densities (or
luminosities), R, have been extensively used for this purpose. The
commonly accepted dividing line between the two populations,
established by studies of optically-selected AGN, is
and its
equivalent, the ratio of radio to optical flux densities (or
luminosities), R, have been extensively used for this purpose. The
commonly accepted dividing line between the two populations,
established by studies of optically-selected AGN, is ![]() (Kellerman et al.1989; Stocke et al.1992), or
(Kellerman et al.1989; Stocke et al.1992), or
![]() . The flux densities are typically taken at 5 GHz
and an observed wavelength of 4400 Å, taken from the B magnitude.
A second criterion is the radio luminosity; the division occurs
. The flux densities are typically taken at 5 GHz
and an observed wavelength of 4400 Å, taken from the B magnitude.
A second criterion is the radio luminosity; the division occurs ![]() [W Hz-1] (Miller et al.
1990; Stocke et al.1992), with some dependence on
redshift (Padovani 1993). Miller et al.(1990) note
that the luminosity criterion is to be preferred if the optical and radio
emission of AGN are not correlated. The two definitions overlap by
approximately 90% (Kellerman et al.1994; Della Ceca
et al.1994). Falcke et al.(1996) have proposed
separate radio-loud - radio-quiet criteria for flat- and steep-spectrum
quasars:
[W Hz-1] (Miller et al.
1990; Stocke et al.1992), with some dependence on
redshift (Padovani 1993). Miller et al.(1990) note
that the luminosity criterion is to be preferred if the optical and radio
emission of AGN are not correlated. The two definitions overlap by
approximately 90% (Kellerman et al.1994; Della Ceca
et al.1994). Falcke et al.(1996) have proposed
separate radio-loud - radio-quiet criteria for flat- and steep-spectrum
quasars: ![]() (
(![]() ) for steep-spectrum
sources and
) for steep-spectrum
sources and ![]() (
(![]() ) for flat-spectrum.
) for flat-spectrum.
The radio-loud - radio-quiet dichotomy is most evident as
bimodality in the distributions of the measures R, ![]() , or
, or
![]() . Bimodality has been reported for both optically-selected
samples (e.g. Sramek & Weedman 1980; Kellerman et al.
1989, 1994; Miller et al.1990; Visnovsky et al.
1992; Stocke et al.1992) and the X-ray-selected sample
of AGN from the Einstein Medium Sensitivity Survey (EMSS; Della Ceca
et al.1994). Bimodality is sometimes evident in the distribution of
radio flux densities, at least for optically-selected samples
(Strittmatter et al.1980; Kellerman et al.1989).
Evidence in terms of other observed AGN properties, such as redshift and
optical luminosity, has been more difficult to establish.
. Bimodality has been reported for both optically-selected
samples (e.g. Sramek & Weedman 1980; Kellerman et al.
1989, 1994; Miller et al.1990; Visnovsky et al.
1992; Stocke et al.1992) and the X-ray-selected sample
of AGN from the Einstein Medium Sensitivity Survey (EMSS; Della Ceca
et al.1994). Bimodality is sometimes evident in the distribution of
radio flux densities, at least for optically-selected samples
(Strittmatter et al.1980; Kellerman et al.1989).
Evidence in terms of other observed AGN properties, such as redshift and
optical luminosity, has been more difficult to establish.
 |
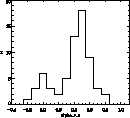
Figure 9:
Distribution of the radio-to-optical spectral index
|
Figure 9 shows the distribution of ![]() values for the reliable NEP sources (Tables 1 and 2). A bimodal
distribution is strongly suggested, with a minimum
values for the reliable NEP sources (Tables 1 and 2). A bimodal
distribution is strongly suggested, with a minimum ![]() . This
is in good agreement with the minimum value of
. This
is in good agreement with the minimum value of ![]() found for
optically-selected samples and the value of
found for
optically-selected samples and the value of ![]() obtained by Della Ceca et al.'s results for EMSS AGN. (The different radio
frequencies and the lack of K-corrections for the NEP sample would
change
obtained by Della Ceca et al.'s results for EMSS AGN. (The different radio
frequencies and the lack of K-corrections for the NEP sample would
change ![]() by approximately
by approximately ![]() .)
It should be noted that the NEP sources include non-AGN (such as
the apparent cD galaxies of several group candidates). As the NEP and EMSS
samples have roughly similar sensitivities in the
radio (
.)
It should be noted that the NEP sources include non-AGN (such as
the apparent cD galaxies of several group candidates). As the NEP and EMSS
samples have roughly similar sensitivities in the
radio (![]() 1 mJy at 1.5 and 5 GHz, respectively), optical (
1 mJy at 1.5 and 5 GHz, respectively), optical (![]() 23 mag in V and B), and X-ray (
23 mag in V and B), and X-ray (![]() erg s-1
for 0.1-2.4 keV and
erg s-1
for 0.1-2.4 keV and ![]() erg s-1 for
0.3-3.5 keV), the NEP sample's results provide further confirmation of
bimodality but do not extend it to significantly fainter limits.
The minimum in the
erg s-1 for
0.3-3.5 keV), the NEP sample's results provide further confirmation of
bimodality but do not extend it to significantly fainter limits.
The minimum in the ![]() distribution is also evident as a
sparsely-populated band ("gap'') in the
distribution is also evident as a
sparsely-populated band ("gap'') in the ![]() and
and ![]() (Sect. 5.4)
plots. The gap is most apparent if different morphological classes are
considered separately. Although bimodality is not evident in RGB sample
(its
(Sect. 5.4)
plots. The gap is most apparent if different morphological classes are
considered separately. Although bimodality is not evident in RGB sample
(its ![]() distribution cuts off at the lower limit of
radio-loudness), it is quite evident in the sample of radio-selected,
ROSAT-detected quasars drawn from the Véron-Cetty - Véron (1993)
catalog (VV93) studied by Brinkmann et al.(1997; see Fig. 16).
distribution cuts off at the lower limit of
radio-loudness), it is quite evident in the sample of radio-selected,
ROSAT-detected quasars drawn from the Véron-Cetty - Véron (1993)
catalog (VV93) studied by Brinkmann et al.(1997; see Fig. 16).
While AGN classes often overlay in the ![]() diagram, they can occupy more distinct regions in the
diagram, they can occupy more distinct regions in the ![]() (or equivalently,
(or equivalently, ![]() )diagram. For example, X-ray-selected BL Lacs and radio-selected BL Lacs are
widely separated in this diagram with BL Lacs from the RGB survey filling
the gap between these populations (Fig. 11 in Paper II; Laurent-Muehleisen
et al.1998). Figure 10 shows the flux ratio diagram
for objects in Tables 1 and 2. Objects on the top right should be mainly
galaxies, X-ray-selected BL Lacs reside in the top central region, while
quasars and radio-selected BL Lac objects congregate at the lower left. The
diagram is similar to that of the optically unidentified objects from
the RGB survey (Fig. 11 in Paper II), indicating that the populations have
not changed dramatically between the brighter RGB and fainter NEP
samples. The optically faint and unclassified NEP sources are spread
throughout the region of radio- and X-ray-selected AGN. However, few
are present among the Seyferts and other galaxies in the radio-quiet
regime,
)diagram. For example, X-ray-selected BL Lacs and radio-selected BL Lacs are
widely separated in this diagram with BL Lacs from the RGB survey filling
the gap between these populations (Fig. 11 in Paper II; Laurent-Muehleisen
et al.1998). Figure 10 shows the flux ratio diagram
for objects in Tables 1 and 2. Objects on the top right should be mainly
galaxies, X-ray-selected BL Lacs reside in the top central region, while
quasars and radio-selected BL Lac objects congregate at the lower left. The
diagram is similar to that of the optically unidentified objects from
the RGB survey (Fig. 11 in Paper II), indicating that the populations have
not changed dramatically between the brighter RGB and fainter NEP
samples. The optically faint and unclassified NEP sources are spread
throughout the region of radio- and X-ray-selected AGN. However, few
are present among the Seyferts and other galaxies in the radio-quiet
regime, ![]() (
(![]() ).
The
).
The ![]() diagram is consistent with
Fig. 8 in suggesting that several source
identifications may be incorrect.
diagram is consistent with
Fig. 8 in suggesting that several source
identifications may be incorrect.
 |
Figure 10:
Flux ratios
logf |
 |
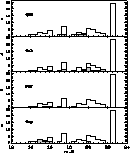
Figure 11: Distribution of various object types as function of the optical B - magnitude. Open histogram: all objects; shaded region: specific object class |
Copyright The European Southern Observatory (ESO)