In anticipation of the deep ROSAT exposure of the NEP, 1.5 GHz continuum
observations of a region of 29.3 square degrees centered on the NEP were
carried out with the NRAO Very Large Array![]() in 1990 and 1991. One hundred
fourteen contiguous fields were observed in the C configuration
giving an effective resolution around 12
in 1990 and 1991. One hundred
fourteen contiguous fields were observed in the C configuration
giving an effective resolution around 12![]() . The survey is sensitive to
1-2 mJy, with the value dependent on location with respect to the field
centers and field exposure times. A catalog of 2435 sources
was generated, with total flux densities ranging from 0.3 to 1000 mJy and
positions for most objects accurate to at least 2
. The survey is sensitive to
1-2 mJy, with the value dependent on location with respect to the field
centers and field exposure times. A catalog of 2435 sources
was generated, with total flux densities ranging from 0.3 to 1000 mJy and
positions for most objects accurate to at least 2![]() . The catalog and the
survey methodology are given by Kollgaard et al.(1994), and the
individual fields are displayed by Hertz et al.(1994). This
survey was several fold more sensitive, and produced an order of magnitude
more sources, than previous radio surveys of the NEP region (e.g. Loiseau
et al.1988; Lacy et al.1992; Lacy et al.
1995 and references therein), with sensitivities similar to the
recent NVSS (Condon et al.1998) and FIRST (Becker et al.
1995) VLA surveys.
. The catalog and the
survey methodology are given by Kollgaard et al.(1994), and the
individual fields are displayed by Hertz et al.(1994). This
survey was several fold more sensitive, and produced an order of magnitude
more sources, than previous radio surveys of the NEP region (e.g. Loiseau
et al.1988; Lacy et al.1992; Lacy et al.
1995 and references therein), with sensitivities similar to the
recent NVSS (Condon et al.1998) and FIRST (Becker et al.
1995) VLA surveys.
Optical candidates of RASS-VLA sources, their magnitudes and morphological
classifications (starlike or galaxy) were selected primarily from a catalog of
objects obtained from COSMOS scans of the second Palomar Observatory Sky
Survey (POSS-II) plates provided by W.L.W. Sargent (CalTech).
The catalog was created through a collaboration between
the Naval Research Laboratory (NRL) and the Royal Observatory, Edinburgh
(ROE) in support of the ROSAT mission (Yentis et al.1992).
Three blue (IIIa-J and GG395 filter) plates (PSIIJ071, PSIIJ102, and
PSIIJ103) and two red (IIIa-F and RG610 filter) plates (PSIIF070 and
PSIIF103) were available for candidate selection. Since the red plates
covered only about two-thirds of the region of the RASS-VLA survey, they
were used mainly in cases of ambiguous classification of sources. Typical
limiting magnitudes of the POSS-II plates are ![]() mag and
mag and ![]() mag; the variation from plate to plate is
mag; the variation from plate to plate is ![]() mag
(Reid et al.1991). Standard star calibrations of individual
plates yield photometric accuracies of a few tenths to 0.5 mag. However,
resolved and/or bright objects pose certain problems and discrepancies with
published magnitudes can exceed these values.
The star-galaxy separation is expected to be reliable to a limit of
mag
(Reid et al.1991). Standard star calibrations of individual
plates yield photometric accuracies of a few tenths to 0.5 mag. However,
resolved and/or bright objects pose certain problems and discrepancies with
published magnitudes can exceed these values.
The star-galaxy separation is expected to be reliable to a limit of
![]() (MacGillivray & Stobie 1984), although
bright nearby galaxies pose special problems for the recognition of and
integration over their full extent. Magnitudes for brighter objects were
obtained from the NASA Extragalactic Database (NED) when available.
Astrometric calibration of COSMOS-scanned plates is performed with the FK4
catalog; a conservative estimate of the positional accuracy is 1
(MacGillivray & Stobie 1984), although
bright nearby galaxies pose special problems for the recognition of and
integration over their full extent. Magnitudes for brighter objects were
obtained from the NASA Extragalactic Database (NED) when available.
Astrometric calibration of COSMOS-scanned plates is performed with the FK4
catalog; a conservative estimate of the positional accuracy is 1![]() (MacGillivray, private communication).
(MacGillivray, private communication).
Additional candidates, magnitudes and classifications were selected from a
catalog of objects obtained from POSS-I O and E plates digitized with the
Automatic Plate Measuring (APM) machine at 1.0![]() resolution
(McMahon 1991). The catalog was provided to us by R.G.
McMahon. We initially consulted the APM catalog to fill in a small survey
region covered only by a POSS-II red plate. Although the APM catalog is not
as deep as the COSMOS catalog, we found the APM catalog to be more
consistent with published magnitudes and have used this to
calibrate the magnitudes from the COSMOS plates (Sect. 3.2). The
photometric accuracy of APM magnitudes is approximately
resolution
(McMahon 1991). The catalog was provided to us by R.G.
McMahon. We initially consulted the APM catalog to fill in a small survey
region covered only by a POSS-II red plate. Although the APM catalog is not
as deep as the COSMOS catalog, we found the APM catalog to be more
consistent with published magnitudes and have used this to
calibrate the magnitudes from the COSMOS plates (Sect. 3.2). The
photometric accuracy of APM magnitudes is approximately ![]() mag
(Laurent-Muehleisen et al.1996; Gregg et al.1996;
see also McMahon & Irwin 1992).
mag
(Laurent-Muehleisen et al.1996; Gregg et al.1996;
see also McMahon & Irwin 1992).
The ROSAT All-Sky Survey (RASS) was conducted with the Position
Sensitive Proportional Counter PSPC-C on board ROSAT continuously
between August 1990 and February 1991. The mission and the instrument are
described by Trümper (1983), Pfeffermann et al.
(1986), and Aschenbach (1988). A preliminary source
list (RASS-I processing) has about 60000 sources (Voges
1992). In recent correlations of this list with radio catalogs
(Brinkmann et al.1994, Papers I, II) X-ray data were used
which were processed in single 2![]() survey strips. In this paper we
utilize data summed up over the whole mission in the NEP region. The
accumulated data were organized in nine 3
survey strips. In this paper we
utilize data summed up over the whole mission in the NEP region. The
accumulated data were organized in nine 3![]() 3
3![]() fields
centered on the NEP.
fields
centered on the NEP.
 |
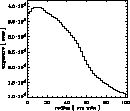
Figure 1: Average Survey exposure in sec for the central field centered on the NEP as function of the radial distance from the geometrical center of the Survey exposure map |
The exposure ranged from ![]() 40000 s near the NEP to
40000 s near the NEP to ![]() 5000
s
5000
s ![]() off the NEP. In Fig. 1 we show the
radially averaged exposure map of the central region around the NEP. The
exposure times are corrected for instrumental vignetting and deadtime effects
centered
off the NEP. In Fig. 1 we show the
radially averaged exposure map of the central region around the NEP. The
exposure times are corrected for instrumental vignetting and deadtime effects
centered ![]() north of the nominal position of the NEP. Although the
exposure is not exactly rotationally symmetric due to missing Survey strips, the
curve clearly shows the arcsin (1/cos
north of the nominal position of the NEP. Although the
exposure is not exactly rotationally symmetric due to missing Survey strips, the
curve clearly shows the arcsin (1/cos![]() ) behaviour at larger distances
from the NEP, modified by the shadowing of the PSPC's support grid and the
non-uniform detector sensitivity. The local minimum at the center is
caused by the continuous crossing of the central support grid and
broadened by the slight offsets of the satellite orbit after scan
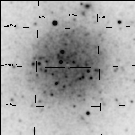
reversals. This "exposure hole" can be seen in Fig. 2
where we plot a smoothed grey scale image of the central
) behaviour at larger distances
from the NEP, modified by the shadowing of the PSPC's support grid and the
non-uniform detector sensitivity. The local minimum at the center is
caused by the continuous crossing of the central support grid and
broadened by the slight offsets of the satellite orbit after scan
reversals. This "exposure hole" can be seen in Fig. 2
where we plot a smoothed grey scale image of the central ![]() region around the NEP. The image demonstrates the
high density of X-ray sources in the inner field and shows the
slight asymmetry of the exposure.
region around the NEP. The image demonstrates the
high density of X-ray sources in the inner field and shows the
slight asymmetry of the exposure.
 |
Figure 2:
ROSAT broad band photon image of the central
|
A catalog of X-ray positions and count rates was constructed from a source detection procedure built on standard commands available in the EXSAS environment and applied to each of the nine fields (Zimmermann et al. 1994). Two preliminary source detection procedures were used to generate locations of probable sources, which were used as input into a maximum likelihood procedure for the production of final source lists and properties.
 |
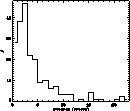
Figure 3:
Distance in arcsec between the same sources found from the total
detector and the inner part only for the central |
For most of the RASS it has been shown that the highest signal-to-noise is
achieved with the full field of view of the detector for the source detection
algorithm, even though the point spread function of the X-ray telescope
degrades rapidly in the outer regions of the PSPC detector (Aschenbach,
private communication). However, in regions of high source density like the
NEP, the degraded point spread function causes an increase of the background
flux through source confusion. We therefore repeated the source detection
procedure for the deep central 3![]() 3
3![]() NEP field using only
photons from the inner part (
NEP field using only
photons from the inner part (![]()
![]() ) of the PSPC where the
point spread function is uniform and narrow (
) of the PSPC where the
point spread function is uniform and narrow (![]() 30
30![]() ). Although this
reduces the exposure by 2/3 compared to the analysis using the full detector, we
found that the number of sources increased from 266 sources to 583 sources
when only the inner detector is used. The density of sources at the center
of the field reaches
). Although this
reduces the exposure by 2/3 compared to the analysis using the full detector, we
found that the number of sources increased from 266 sources to 583 sources
when only the inner detector is used. The density of sources at the center
of the field reaches ![]() 100 sources/square degree.
100 sources/square degree.
We have compared source properties obtained using the whole PSPC and the
inner detector alone.
Figure 3 shows that positional offsets are
generally less than 10![]() ; exceptions are due to extended sources. We
conclude that the internal accuracy of source positions is about
; exceptions are due to extended sources. We
conclude that the internal accuracy of source positions is about
![]()
![]() for unresolved sources. Even after accounting for
systematic errors the accuracy should be better than the
for unresolved sources. Even after accounting for
systematic errors the accuracy should be better than the ![]() 18
18![]() (68% level) found for the whole RASS (Voges et al.1996) due
to repeated exposure of the NEP region during the survey.
For many sources, the inner detector
analysis yielded more source photons, increased likelihood values and higher
count rates (Fig. 4). The improvement is most pronounced
for weaker sources. Outliers are again due to extended sources,
indicating that source properties for these sources are highly
dependent on the particular data analysis path chosen.
(68% level) found for the whole RASS (Voges et al.1996) due
to repeated exposure of the NEP region during the survey.
For many sources, the inner detector
analysis yielded more source photons, increased likelihood values and higher
count rates (Fig. 4). The improvement is most pronounced
for weaker sources. Outliers are again due to extended sources,
indicating that source properties for these sources are highly
dependent on the particular data analysis path chosen.
The result of our analysis, using the inner detector for the central 3![]() 3
3![]() field and the full detector in the remainder of the 9
field and the full detector in the remainder of the 9![]() 9
9![]() region around the NEP, is the detection of more than 1700
sources. Due to the higher exposure, the central field contains
583 of these sources.
region around the NEP, is the detection of more than 1700
sources. Due to the higher exposure, the central field contains
583 of these sources.
Only 18 sources have sufficient photons to permit direct estimation of the X-ray
spectra. These spectra are discussed in Sect. 2.3.3. To estimate source fluxes for
the remaining sources, we follow the analyses in Papers I and II and assume a
power law spectrum with photon index ![]() and galactic
absorption
and galactic
absorption ![]() (Dickey & Lockman 1990) in the direction
of the source.
(Dickey & Lockman 1990) in the direction
of the source. ![]() varies relatively smoothly even on shorter angular
scales (Elvis et al.1994). The unabsorbed X-ray fluxes in the
ROSAT band
varies relatively smoothly even on shorter angular
scales (Elvis et al.1994). The unabsorbed X-ray fluxes in the
ROSAT band ![]() are computed using the source count rates
and the energy-to-counts conversion factor for a power law fit (ROSAT AO-2
technical appendix, 1991). The resulting fluxes will be inaccurate for sources
with intrinsic absorption, different power law or complex spectra. We report
here only errors due to the counting statistics.
are computed using the source count rates
and the energy-to-counts conversion factor for a power law fit (ROSAT AO-2
technical appendix, 1991). The resulting fluxes will be inaccurate for sources
with intrinsic absorption, different power law or complex spectra. We report
here only errors due to the counting statistics.
Fluxes for sources in the inner field can be compared with those found by
Bower et al.(1996) in their pointed observations. They
report fluxes assuming a power law index of ![]() and a narrower
(0.5 - 2 keV) energy interval, giving a systematic reduction factor of
and a narrower
(0.5 - 2 keV) energy interval, giving a systematic reduction factor of
![]() 0.4 compared to our values. Taking this into account, we find
excellent agreement between the fluxes in most cases, indicating
consistency between the data analyses for pointed observations and the
approach followed here.
0.4 compared to our values. Taking this into account, we find
excellent agreement between the fluxes in most cases, indicating
consistency between the data analyses for pointed observations and the
approach followed here.
Eighteen of the RASS sources in Tables 1-3 have >100 photons, allowing
simple spatial and spectral fitting of the PSPC data. Note that in some cases
the objects are in crowded fields or in regions with strongly changing exposure
so that the background subtraction may not be accurate. Table 4 presents the
results of spectral fits using a power model with Galactic column densities. The
columns give the source name, the number of vignetting- and
deadtime-corrected counts, the fitted power law photon index with its
1![]() error, the reduced
error, the reduced ![]() for the fit, a likelihood parameter
ML
for the fit, a likelihood parameter
ML![]() that increases with the probability that the source is
spatially extended, and remarks.
In most cases the photon index is consistent with the expected
that increases with the probability that the source is
spatially extended, and remarks.
In most cases the photon index is consistent with the expected ![]() (Sect. 2.3.2), albeit with large statistical errors.
(Sect. 2.3.2), albeit with large statistical errors.
Copyright The European Southern Observatory (ESO)