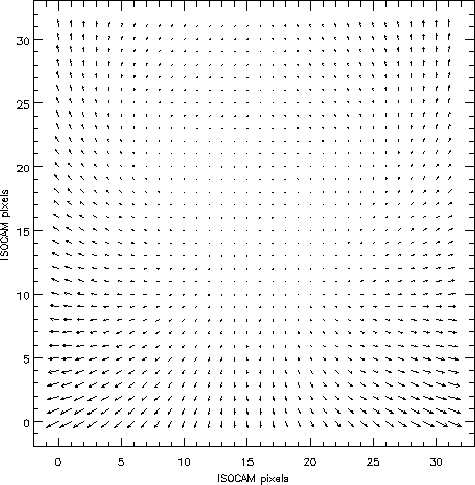
Field distortion in ISOCAM is mostly due to the off-axis mirror that directs the light beam toward each detector and to the fact that the ISOCAM field of view is an off-axis part of the full FOV of the ISO telescope. The field distortion was measured for the LW channel 6'' and 3'' lenses, using calibration observations of fields that contained many stars. No measurements have been made for the 1.5'' lens because they are difficult to perform as the amplitude of the satellite jitter is of the order of the quantities to be measured. Since the distortion with the 1.5'' lens is predicted to be negligible, no error would be made if it is not taken into account.
ISOCAM also suffers from lens wheel jitter. In order to avoid any mechanical blocking, the gear wheel has been designed with a small play. Therefore, the position at which the lens stops is not fixed.
It has been shown by the CAM Instrument Dedicated Team that
there are only two broad families of positions that the lens wheel
can take for a
commanded position, and it is suspected that the wheel stops at either
side of the play. This can be very easily detected by close
inspection of the flat field derived from the data: the leftmost
column of the detector receives very little light. This is called the
"left'' position. This jitter results in an offset of about 1.2
pixels of the optical axis, thus ![]() 7'' with the 6'' lens. It
also modifies the distortion pattern and therefore the latter has been
measured for both positions. The measurement method is discussed in
Aussel (1997).
7'' with the 6'' lens. It
also modifies the distortion pattern and therefore the latter has been
measured for both positions. The measurement method is discussed in
Aussel (1997).
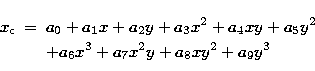
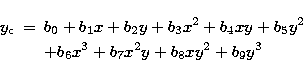
Following the work done on the HST WFPC by Holtzman et al. (1995), each measurement is fitted with a general polynomial of degree 3, that is:
 |
||
| (23) |
 |
||
| (24) |
Since the pixel size is not uniform on the sky, the pixels at the edges of
the array cover a wider surface. Therefore, a new flat-field correction has
to be applied in order to account for it. This flat-field is of the
form:
 |
(25) |
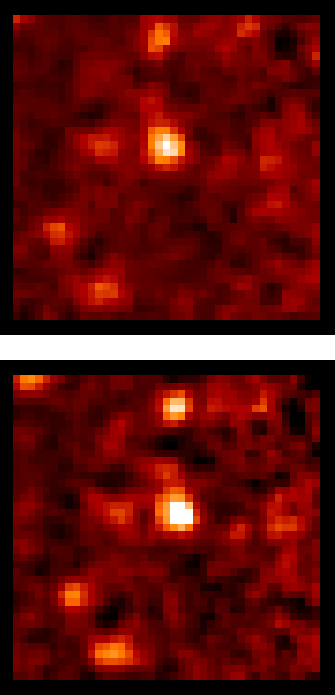 |
Figure 9:
Zoom on a part of the ISOCAM Hubble Deep Field observation at |
This is where distortion corrections stop in the case of staring
observations. In a raster mode, where an image has to be constructed
from the coaddition of many smaller ones, the processing continues as
follows: each raster sub-image is projected on the raster map, using a
flux-conservative shift and add algorithm. The intersecting surface
S(x,y,i,j) of each sky pixel of the raster map with each ISOCAM
pixel is computed. The flux in the pixel (x,y) of the raster map is
therefore:
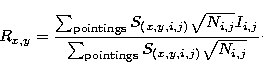 |
(26) |
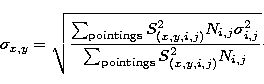 |
(27) |
Figure 9 shows a zoom on a part of the ISOCAM
Hubble Deep Field observation at 15![]() m. The same processing was
applied to the two images, except for the correction of the distortion
(pixel size is 2'').
m. The same processing was
applied to the two images, except for the correction of the distortion
(pixel size is 2'').
Copyright The European Southern Observatory (ESO)