next previous
Up: Multi-frequency study of the sample


Subsections

3 Results

3.1 Flux densities at $\lambda$2.8 cm


Table 1: B3VLA sources at 10.6 GHz
\begin{table}
\includegraphics []{1562ta.eps}
\end{table}


Table 1: continued
\begin{table}
\includegraphics []{1562tb.eps}
\end{table}


Table 1: continued
\begin{table}
\includegraphics []{1562tc.eps}
\end{table}


Table 1: continued
\begin{table}
\includegraphics []{1562td.eps}
\end{table}


Table 1: continued
\begin{table}
\includegraphics []{1562te.eps}
\end{table}


Table 1: continued
\begin{table}
\includegraphics []{1562tf.eps}
\end{table}


Table 1: continued
\begin{table}
\includegraphics []{1562tg.eps}
\end{table}


Table 1: continued
\begin{table}
\includegraphics []{1562th.eps}
\end{table}


Table 1: continued
\begin{table}
\includegraphics []{1562ti.eps}
\end{table}


Table 1: continued
\begin{table}
\includegraphics []{1562tj.eps}
\end{table}

The flux densities derived as described in Sect. 2 are compiled in Table 1. Column 1 gives the B3 source names, Cols. 2 and 3 the radio centroid (equinox B1950.0) from Vigotti et al. (1989) (computed as the geometric mean of the source components). Columns 4 and 5 contain the measured peak (${ S}_{\rm peak}$) and integrated (${ S}_{\rm int})$ flux densities. The peak flux density was not given for sources that were mapped. When a source was not detected we give an upper limit (marked with a "<" in Col. 5), which corresponds to a 3-$\sigma$ noise computed for the final cross-scan. Column 6 is the updated optical identification. The symbols are g: radio galaxy identified on the POSS-I, most of which are at ${z} \le 0.5$; G: far radio galaxy with measured redshift ($0.5 \le { z} \le 3.5$); Q: spectroscopically confirmed quasar; b: blue objects (i.e. non-confirmed quasars); BL: BL Lac; F: featureless spectrum; a blank means "empty field", i.e. it lacks any optical counterpart down to the POSS-I limit (more than 90$\%$ are distant radio galaxies, the remaining ones being quasars with magnitudes fainter than the POSS-I). So far the B3-VLA sample is composed of $27\%$ galaxies, $12\%$ quasars, and $61\%$ empty fields.
  
\begin{figure}
\epsfxsize=8cm
\begin{center}

\epsfbox {ds1562f2.eps}
\end{center}\vspace*{5mm}\end{figure} Figure 2: Plot of flux densities measured at two different epochs
In order to have an independent check on the accuracy of our measurements and to evaluate the uncertainties of the flux densities, 143 sources were re-observed. These sources were chosen in different flux bins. Figure 2 shows the plot of the fluxes measured in the two independent observations. Intrinsic source variability increases the scatter of the plot. The analysis of the distribution of the differences between two or more independent flux measurements of the same source allowed for a determination of the random errors affecting the measurements. These errors are the quadratic sum of three terms: the first, proportional to the source intensity, is introduced by gain instabilities of the receiver; the other two, independent of the source flux density, are due to noise and confusion. The first term was computed using sources with flux densities greater than 500 mJy as well as calibrators, and was found to be $\sim 2\%$. From the faint sources we evaluated the rms noise; we subdivided the sources into different classes according to number of scans (i.e. observing time) and found that this term is in the range 0.6 - 0.8 mJy. To be conservative we chose 0.8 mJy. For the confusion term we refer to Reich (1993) who reports a value of 0.08 mJy. We expect that the error affecting the flux density measurements is:

\begin{displaymath}
\sigma_{\rm S} = \sqrt{(0.02 \cdot S_{\rm tot})^2 + 0.08^2 + 0.8^2}\end{displaymath}


where $S_{\rm tot}$ is in mJy. To compute the spectral index between 408 MHz and 10.6 GHz (presented in Fig. 3a) the low-frequency flux densities were increased by 5% to

adjust them to the scale of Baars et al. (1977). The spectral indices of B30226+394, B30241+393B, B30920+408, B31016+388B, B31428+385, B31447+402, B32333+397, and B32348+387 were not included; the VLA maps show that the components of these triple sources are probably not physically connected.

  
\begin{figure}
\epsfxsize=8cm
\begin{center}

\epsfbox [65 190 560 688]{ds1562f3.eps}
 \end{center}\vspace*{5mm}
\vspace*{2mm}\end{figure} 
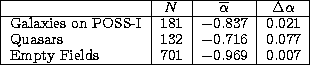
Figure 3: Histograms of spectral indices between 408 MHz and 10.6 GHz. a) for the whole sample, b) for POSS-I galaxies, c) for empty fields, and d) for quasars (see text)
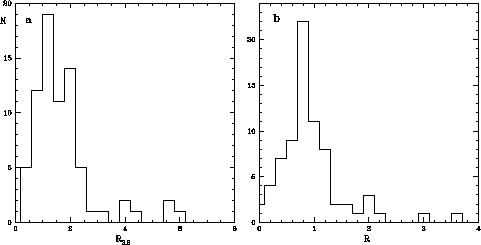
The spectral indices have a broad distribution with a median value of $\alpha_{\rm med}=-0.933$ and an average value of $\overline{\alpha}=-0.906$. Figures 3b, 3c, and 3d show the histograms of the spectral indices for three different classes of optical counterparts, i.e. galaxies bright enough to appear on the POSS-I (most of which are at z < 0.5), empty fields on the POSS-I (most of which are galaxies z > 0.5), and quasars. In Table 2 we have compiled the mean spectral indices ($\overline{\alpha}$) and their uncertainties ($\Delta \alpha$)for different optical identifications.


Table 2: Spectral indices for different optical identifications

\begin{tabular}
{\vert l\vert c\vert c\vert c\vert}\hline
 & $N$\space & $\overl...
 ...e & 0.077 \\  Empty Fields & 701 & $-0.969$\space & 0.007 \\ \hline\end{tabular}

The distributions of the first two classes are similar, but the different average values (see Table 2) indicate that high-redshift radio galaxies have steeper spectra. The distribution for quasars shows the presence of two populations: steep-spectrum and flat-spectrum quasars.
  
\begin{figure}
\epsfxsize=8cm
\begin{center}

\epsfbox {ds1562f4.eps}
 \end{center}\vspace*{6mm}\vspace*{1cm}\end{figure} Figure 4: Histograms of ratios of component flux densities of double sources at a) $\lambda$2.8 cm, and b) the ratio of the ratios (see text)

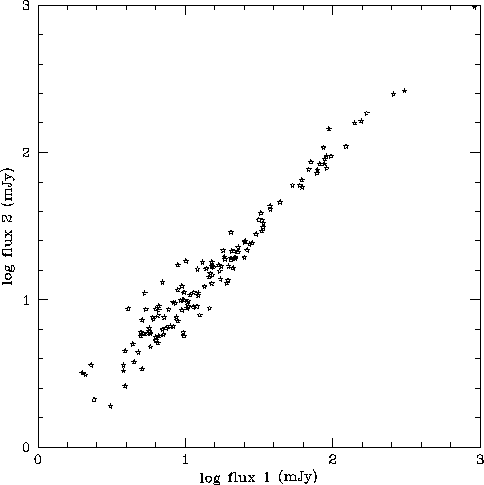
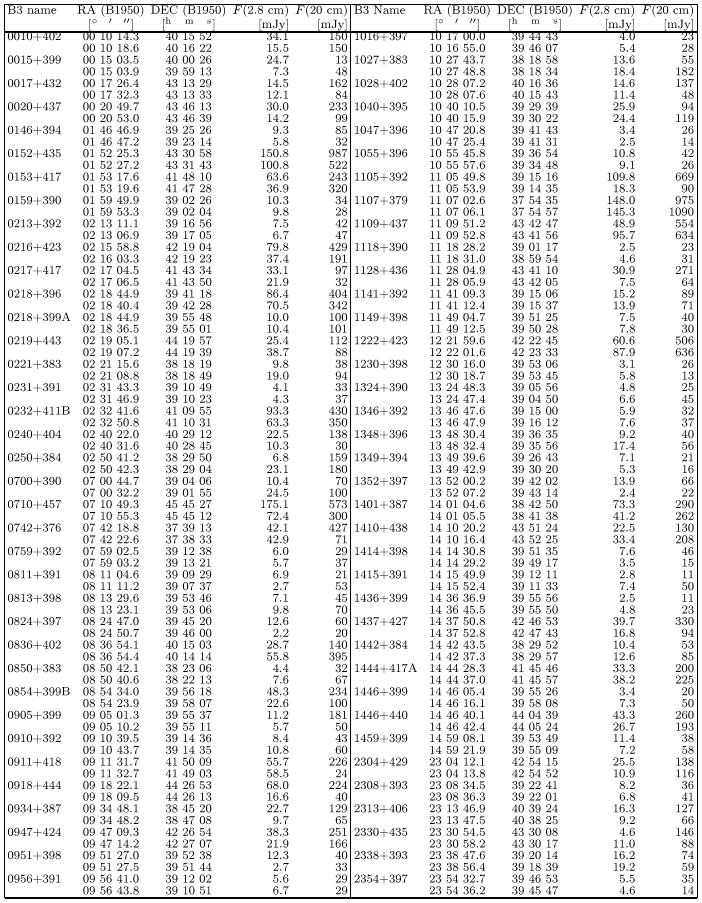
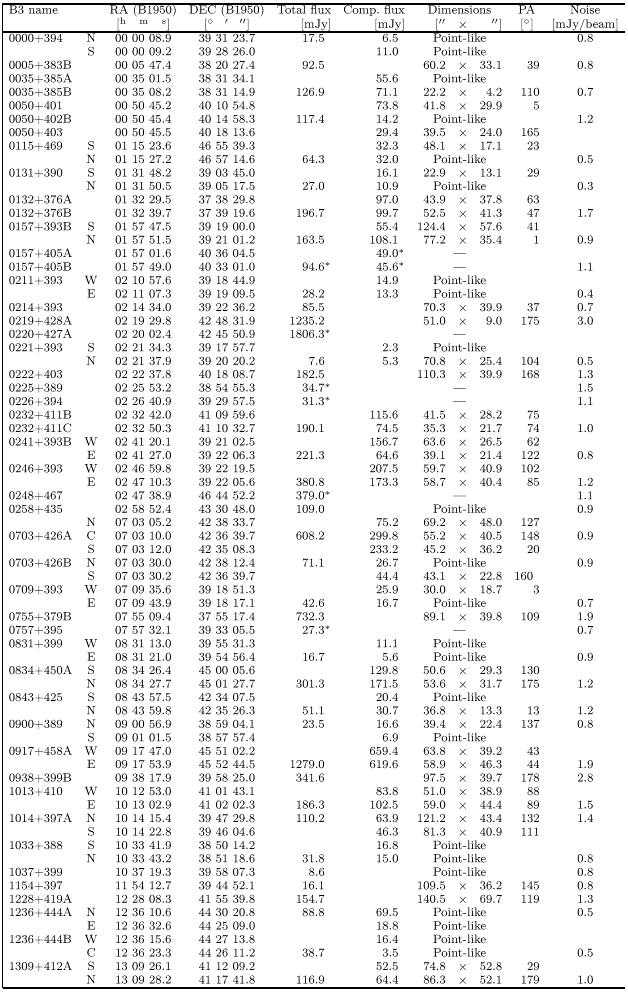
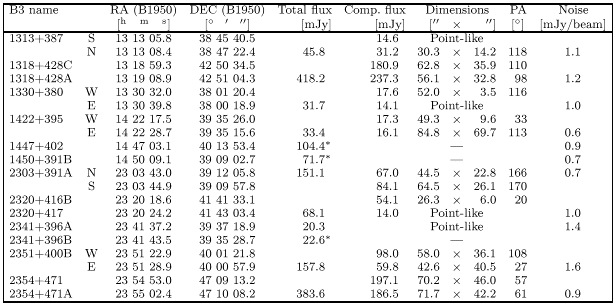
For the decomposed double sources (see Sect. 2) Table 3 presents in Col. 1 the B3 source names, in Cols. 2 and 3 the positions (equinox B1950.0) of the components from Vigotti et al. (1989); Cols. 4 and 5 give the flux densities at $\lambda$2.8 cm and $\lambda$20 cm (Vigotti et al. 1989), respectively. For each source we have computed the component ratio R2.8 of the flux density at $\lambda$2.8 cm (see Fig. 4a), and the ratio R20 of the flux density at $\lambda$20 cm, then the ratio R=R2.8/R20 (see Fig. 4b). These ratios were computed considering as the first component the brightest one at 20 cm. Figure 4a shows that the double sources at $\lambda$2.8 cm


Table 3: B3-VLA decomposed double sources


Table 4: B3VLA sources at 10.6 GHz: the maps


Table 4: continued

are symmetric with respect to the flux densities; in fact only 18% have a ratio greater than 2 (very high values could also be an indication that the two components are not physically connected). Figure 4b shows that only 10% of double sources change their flux density ratio between 1.4 and 10.6 GHz by more than a factor of 2.
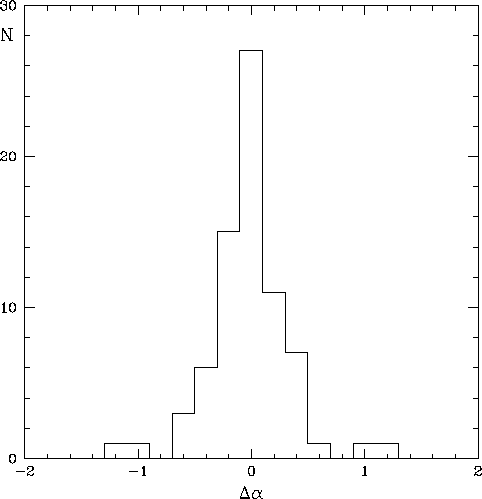
  
\begin{figure}
\epsfxsize=8cm
\begin{center}

\epsfbox {ds1562f5.eps}
 \end{center}\vspace*{7mm}\vspace*{7mm}\end{figure} Figure 5: Histogram of the difference $\Delta \alpha$ between the spectral indices of the two components of double sources
The spectral index computed between $\lambda\lambda$20 cm and 2.8 cm for the single components has a median value of -0.890. Figure 5 presents the difference $\Delta \alpha$ between the spectral indices of the two components of the 74 double sources. The distribution of $\Delta \alpha$ is asymmetric, in the sense that source components that are brighter at $\lambda$20 cm exhibit slightly steeper spectra on average. The parameters of the mapped sources are presented in Table 4. Column 1 gives the B3 source names, Col. 2 a letter which marks the component. All the parameters presented in Cols. 3 through 8 are determined with a two-dimensional Gaussian fit to the $\lambda$2.8 cm data. Columns 3 and 4 contain the component positions (equinox B1950.0); Cols. 5 and 6 give the integrated flux of the whole source and of the components, respectively; Cols. 7 and 8 have the FWHM and position angle. Column 9 gives the noise of the map. For complex sources, not well approximated by a Gaussian, the total flux densities are marked with an asterisk. Note that the rms noise in the maps is comparatively low with respect to the cross-scans. This is due to the fact that in mapping all four horns have been used, while in the cross-scans only the main beam was measuring the target, and the offset feeds were used to reject atmospheric noise. It is clear that the reference feeds add uncorrelated noise to the differential signal in the cross-scans, whereas in case of mapping they contribute to the source flux density measurement. In Fig. 6 we show five maps of those sources that exhibit the most complex structure at this resolution.

  
\begin{figure}
\includegraphics [width=13.5cm]{1562f6.eps}\end{figure} Figure 6: Maps of four B3 sources with complex structure at $\lambda$2.8 cm: a) B30050+401 - contour levels: -3, 3, 5, 7, 10, 15, 20, 30, 50 mJy; b) B30248+467 - contour levels: -3, 3, 5, 7, 10, 15, 20, 30, 50, 70, 100, 150, 200 mJy; c) B30703+426 - contour levels: -3, 3, 5, 7, 10, 15, 20, 30, 50, 70, 100, 150, 200 mJy; d) B31309+412A - contour levels: -2, 2, 3, 5, 7, 10, 15, 20, 30 mJy

3.2 Notes on individual mapped sources

Acknowledgements

We are grateful to H. Rottmann and G. Zech for their invaluable help during the many observing runs. We wish to thank our referee, Dr. J.J. Condon, for his useful comments. Part of this work was supported by the Deutsche Forschungsgemeinschaft, grant KL533/4-2, and by the European Commission, TMR Programme, Research Network Contract ERBFMRXCT97-0034 "CERES''. We thank Dr. H. Andernach for a careful check of the tables.


next previous
Up: Multi-frequency study of the sample

Copyright The European Southern Observatory (ESO)