

Up: A statistical method for
We consider the cases for which distributions of sources are assumed
to be known. In these cases, a probability  is well defined on
every event
is well defined on
every event  . This is the probability that the event is found in
the range
. This is the probability that the event is found in
the range  , where
  is the random variable. The cumulative
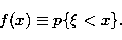
distribution function of the random variable for a given distribution
is defined as
is the random variable. The cumulative
distribution function of the random variable for a given distribution
is defined as
|  |
(1) |
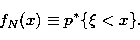
For a sample with size N, the frequency of events with ,  , is used to define the distribution function
|  |
(2) |
Let the sample be  ,
, 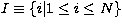 ,
where
,
where  ,
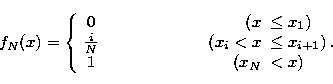
,  . According to the above
definition, we have
. According to the above
definition, we have
|  |
(3) |
According to (1), giving a cumulative distribution function f(x), the
probability of event is known. This is f(x) itself. For a
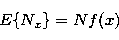
sample, the number of events with , Nx, follows the
well-known binomial distribution, with
|  |
(4) |
and
| ![\begin{displaymath}
{\rm Var}\{N_x\}=Nf(x)[1-f(x)], \end{displaymath}](/articles/aas/full/1998/17/ds7271/img20.gif) |
(5) |
where N is the size of the sample. According to (2), the
distribution function of the sample is
|  |
(6) |
It is clear that fN(x) is simply the percentage of the xi's values
less than x in the sample of size N.
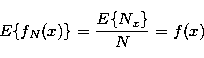
Substituting (6) into (4) and (5) we have
|  |
(7) |
and
| ![\begin{displaymath}
{\rm Var}\{f_N(x)\}=\frac{{\rm Var}\{N_x\}}{N^2}={\frac{f(x)[1-f(x)]}N}. \end{displaymath}](/articles/aas/full/1998/17/ds7271/img23.gif) |
(8) |
Since the variance of the distribution function is known for any
given value of the random variable, we are able to compare observational
data with the given distribution at any data point. This leads to the
following definition.
Definition 1. For a sample with size N, if the following condition
| ![\begin{displaymath}
\left\vert f_N(x)-f(x)\right\vert <{\sqrt{{\frac{f(x)[1-f(x)]}N}}} \end{displaymath}](/articles/aas/full/1998/17/ds7271/img24.gif) |
(9) |
is satisfied for any given x, the sample is said to pass the  distribution function deviation test for the distribution of f(x).
It is clear that this method concerns the individual, rather than the
collective, behavior of samples. By comparing the distribution
function of a sample with the given cumulative distribution function one can
tell if the sample obeys the given distribution at the confidence level using Eq. (9).
Up: A statistical method for
Copyright The European Southern Observatory (ESO)