next previous
Up: A statistical study of galaxies


Subsections

2 Spectral analysis

2.1 Choice of line ratios

Active galaxies are normally classified spectroscopically by several emission line ratios (Veilleux & Osterbrock 1987, hereafter VO87). Following VO87, we select lines with higher signal to noise ratios. The ratios are formed by only one element or with HI Balmer lines and the wavelength separation are chosen to be small, in order to minimize the effects caused by low accuracy, reddening, flux calibration and different metallic abundances. The ratios we used are $\rm [OIII] \lambda 5007 / H\beta$, $\rm [NII] \lambda 6584 / H\alpha$, $\rm [SII](\lambda 6716+\lambda 6731)/H\alpha$ and $\rm [OI]\lambda6300/H\alpha$.

2.2 Line ratios

Before performing spectral classifications, we first correct reddening for emission lines. In principle, reddening includes contributions from the Galaxy, the intergalactic medium and the host galaxy. We ignore the second term since it is expected to be small and there is little knowledge. The Galactic reddening is corrected according to the Burstein & Heiles' (1984) machine-readable reddening table. Since almost all the galaxies we observed have emission lines, and most of them show both $\rm H\alpha$ and $\rm H\beta$ emissions, we can obtain the host galaxy reddening from the ratios of $\rm H\alpha/H\beta$.The Whitford reddening curve as parameterized by Miller & Mathews (1972) is used. We adopt an intrinsic $\rm H\alpha/H\beta$ ratio of 2.85 for HII galaxies and 3.10 for LINERs and Seyferts (Veilleux et al. 1995, hereafter V95). The color excesses E(B-V) can be derived by the relation $E(B-V)=0.77E_{\beta-\alpha}$ (Gebel 1968 and VO87), here $E_{\beta-\alpha}$ is defined by (Miller & Mathews 1972):

\begin{displaymath}
\rm {\it E}_{\beta-\alpha} = 2.5log[({\it I}(H\beta)/{\it I}(H\alpha))_{theory}/({\it I}(H\beta)/{\it I}(H\alpha))_{obs}].\end{displaymath}

The Galactic color excess, observed and theoretical $\rm {\it I}(H\alpha)/{\it I}(H\beta)$, color excess of host galaxies, observed and de-reddened emission line ratios are listed from Col. 2 to Col. 8 in Table 1. We also give the continuum ratios at 6563 Å and 4861 Å in Col. 9. The uncertainty is about 15% as discussed in Paper I. It is clear from Table 1 that for most of our sample galaxies, the reddening corrections are very small, so the errors mainly come from the measurement and aperture effects due to different slit-widths and extraction windows. Since most of the sources have strong line emission of $\rm H\alpha$,$\rm H\beta$, $\rm [NII]\lambda6584$, $\rm [SII]\lambda6716+\lambda6731$ and $\rm [OIII]\lambda5007$, the errors from measurements are less than 10%. From the observation and data reduction, we found that aperture effect introduce errors no larger than the measurement errors. Therefore the final errors for these lines are about 10% - 15%. Colons(:) and semicolons(;) indicate values with uncertainties about 30% and 50% respectively. For the $\rm [OI]\lambda6300$ line the lower S/N and possible blending make the measurement harder, as a result the line ratio $\rm [OI]\lambda6300/H\alpha$ is more uncertain (cf. Paper I and Sect. 4.1).

2.3 Spectral classification

The early classification criterion was given by Baldwin, Phillips & Terlevich (1981), which was based on the ratio of $\rm [OII]\lambda3727 / [OIII]\lambda5007$ and mean excitation to distinguish HII galaxies, Seyfert 2s and LINERs. However, most of our spectra do not cover the $\rm [OII]\lambda3727$ line and further a reliable determination of this line ratio is often difficult even when this line is covered due to its low S/N, therefore, following Osterbrock (1989), we use the line ratios of $\rm [OIII] \lambda 5007 / H\beta$, $\rm [NII] \lambda 6584 / H\alpha$,$\rm [OI]\lambda6300/H\alpha$ and $\rm [SII](\lambda 6716+\lambda 6731)/H\alpha$ for classification purposes instead. The diagnostic diagrams of classifications are shown in Figs. 1-3. The curve and horizontal line at figures divide each panel into three areas. HII galaxies locate at the left side of the curve. The line $\rm [OIII]\lambda5007/H\beta=3$,is used to separate AGN with high excitations - Seyfert 2's from LINERs. We also plot the mean error bar in the low-left.
  
\begin{figure}
{
\psfig {figure=DS1477FIG1.ps,height=8.0cm,width=6.50cm,angle=270}
}\end{figure} Figure 1: De-reddened flux ratio $\rm [OIII] \lambda 5007 / H\beta$ as a function of $\rm [NII] \lambda 6584 / H\alpha$ for VLIRGs. The curve and horizontal line are from VO87. In the low left of the figure, the mean error bar is indicated
  
\begin{figure}
{
\psfig {figure=DS1477FIG2.ps,height=8.0cm,width=6.50cm,angle=270}
}\end{figure} Figure 2: De-reddened flux ratio $\rm [OIII] \lambda 5007 / H\beta$as a function of $\rm [SII]\lambda6716+\lambda6731/H\alpha$ for VLIRGs. The meanings of symbols and curves are the same as in Fig. 1
It is obvious from Figs. 1-3 that there is no clear boundary to separate the different types of galaxies, especially HII galaxies and LINERs. There are quite a few sample galaxies located near the solid curves at figures. Though we have considered the possible errors, there are still some objects which can not be satisfy all the definitions of either HII galaxies or LINERs; for these galaxies they locate at HII galaxies region in one or two diagnostic diagrams, but locate at LINERs region in other diagnostic diagrams. We therefore classify these galaxies as a mixture type. The mixture type galaxies show some similar properties as the LINERs and could be a transitional phase from HII galaxies to AGN (see Sect. 4).
  
\begin{figure}
{
\psfig {figure=DS1477FIG3.ps,height=8.0cm,width=6.50cm,angle=270}
}\end{figure} Figure 3: De-reddened flux ratio $\rm [OIII] \lambda 5007 / H\beta$ as a function of $\rm [OI]\lambda6300/H\alpha$ for VLIRGs. The meanings of symbols and curves are the same as in Fig. 1
It is clear from Figs. 1-3 that there are no galaxies with relatively high ionization level ($\rm [OIII]\lambda5007/H\beta \gt 3$) at the HII galaxy region. This distribution of VLIRGs at the diagnostic diagrams is quite different from the optical sample of VO87, but similar with the results from the the IRAS Bright Galaxy Survey (BGS, V95) and the infrared color-selected samples (Armus et al. 1989). As pointed out by Allen et al. (1991) that the high ionization HII galaxies include extreme starbursts and WR galaxies, the lack of high ionization galaxies in VLIRGs (We found only few WR galaxy in our sample) indicates that VLIRGs do not belong to the young starburst population. The classifications are listed in Col. 10 of Table 1. "H" stands for HII galaxy, "L" for LINER, "S2" for Seyfert 2 and "S1" for Seyfert 1. We use "LH" to represent the mixture type with properties of both HII galaxies and LINERs. "S?" is for unclassified AGNs which can only be distinguished from HII galaxy, due to the lack of data on $\rm [OIII] \lambda 5007 / H\beta$. "O" represents galaxies which can not be classified because they show no or few observed emission lines. We also list the Verons' classification (1993) for some sources in Col. 11.


\begin{tabular}
{r\vert rrrrrrrr}
\multicolumn{9}{l}{{ \bf Table 2a.} {Spectral ...
 ...\it S?}: Seyfert}\\ \multicolumn{9}{l}{\small \rm 2s or LINERs.}\\ \end{tabular}

\begin{tabular}
{r\vert rrrrrrrr}
\multicolumn{9}{l}{{ \bf Table 2b.} {Spectral ...
 ...& 12 & 3 & 3(4) & 3 & 10(12)& 5(6) & 26(28) &62(68)\\ \hline
\hline\end{tabular}

\begin{tabular}
{r\vert rrrrrrrr}
\multicolumn{9}{l}{{ \bf Table 2c.} {Spectral ...
 ...  total & 1 & 0 & 0 & 0 & 0(2) & 0 & 10(12) &11(15)\\ \hline
\hline\end{tabular}


For most objects the two classifications are consistent. However, there are two objects IR23254+0830 and IR13536+1836 which are classified as Seyfert 1's in Verons' Catalogue but show Seyfert 2 properties in our optical spectra and show Seyfert 1 properties only in polarized spectra (Miller & Goodrich 1990). A Seyfert 1 galaxy - IR23532+2513B (Zou et al. 1995) and a Seyfert 2 galaxy -IR23594+3622 are discovered by us.

2.4 Statistic results

Because more than 40% of our sample galaxies are in pairs, possible groups of galaxies or the systems with double nuclei or multi-nuclei of galaxy, the first thing is to determine which component emits the high infrared luminosity. For most target galaxies, the identification is easy using the IRAS position and error ellipse. But for a few sources, we have to use the infrared colors or follow the method of V95 by orders of activity (Seyefrt 1, Seyfert 2, LINER and HII galaxy) to identify the optical counterparts. The statistical results of classification are listed in Tables 2a-c. We present the results of both spectral and morphological classes in these tables. Morphological class would be discussed in Sect. 3.1. In order to keep the results of statistics complete, throughout the paper we use the sample of 73 VLIRGs for statistics. From Table 2, we can see that there are 40% (29/73) HII galaxies in our VLIRGs sample, which is lower than 59% in BGS (V95). It results from our selection of IRAS galaxies with higher infrared luminosity. AGNs (Seyfert 1s, Seyfert 2s, LINERs and mixture types) appear in 44 nuclei (60%) of galaxies. Here we include the mixture types, because they show some similar properties as LINERs as will be shown in Sect. 4.2. There are 6 Seyfert 1's (8%), 6 Seyfert 2's (8%), 6 LINERs (8%), 23 mixture types (32%) and 3 unclassified AGNs (4%). It is obvious that LINER-like objects (LINERs and mixture types) dominate the infrared luminous AGN (66%, 29/44). For a ultraluminous subsample with 11 galaxies, there are 2 HII galaxies (18%), 3 Seyfert 1's (27%), 1 Seyfert 2's (9%), 2 LINERs (18%), 2 mixture types (18%) and 1 unclassified AGN (9%). For the subsample with $\rm 11.5\leq log({\it L}_{IR}/{\it L}_{\odot})\leq 12.0$, there are 3 Seyfert 1s (5%), 5 Seyfert 2s (8%), 4 LINERs (6%), 21 mixtures (34%), 2 unclassified AGNs (3%) and 27 HII galaxies (44%). It is clear from our statistical results that the proportion of AGNs (82%) in the ultraluminous subsample is much higher than that in relatively lower luminous subsample (56%). In addition, the LINER-like galaxies in AGNs decrease rapidly from 71% (25/35) to 44% (4/9), in contrast Seyfert 1s in AGNs increase from 9% (3/35) to 33% (3/9). All these results support the point of view of V95 that the proportions of AGN-like and Seyfert-like galaxies increase as the infrared luminosity increases. The proportions of Seyferts are 13% (8/62) and 36% (4/11) for our lower and higher infrared luminosities' subsamples, respectively. We conclude that our two subsamples have different statistical properties; higher infrared luminosity relates strongly with AGN phenomena.

2.5 Dust in VLIRGs

We have three dust indicators: E(B-V), EW(NaID) and C6563/C4861(Ratio of continuum fluxes at 6563 Å and 4861 Å). E(B-V) represents the reddening of line emission region, C6563/C4861 probes the reddening of continuum emission region and EW(NaID) the interstellar reddening.
  
\begin{figure}
{
\psfig {figure=DS1477FIG4.ps,height=15.00cm,width=12.0cm,angle=270}
}\end{figure} Figure 4: The distributions of color excess and equivalent widths for the NaID line for different spectral types
E(B-V) is obtained from the ratio of $\rm H\alpha/H\beta$. The systematic errors in E(B-V) is unavoidable from the larger wavelength separation of $\rm H\alpha$ and $\rm H\beta$. Furthermore, the aperture sizes in observation and extraction could introduce uncertainty due to the complex geometric structure of dusty regions in the nuclei of VLIRGs. The underlying stellar absorption of $\rm H\alpha$ and $\rm H\beta$ could also influences the accurate measurement of $\rm H\alpha$ and $\rm H\beta$ emission. Combined all these possible factors, the uncertainty of $\rm H\alpha/H\beta$could be as large as 20% - 25%. Similar to $\rm H\alpha/H\beta$, the measurement of continuum C6563/C4861 may also have a larger uncertainty, $\sim \! 20\%$, because of the large wavelength separation. For EW(NaID), the error is about 10% - 15%. Figure 4 is a histogram of E(B-V) for different types of VLIRGs. The median values of E(B-V) for Seyfert 1s, Seyfert 2s, LINERs, Mixtures and HII galaxies are 0.02, 0.97, 0.92, 1.02 and 0.86 respectively. K-S tests show that the probability that Seyfert 1 are drawn from the same distribution as the other four types of galaxies is less than 0.03. Figure 4 also shows the distributions of EW(NaID). It shows that the Seyfert galaxies have lower median EW(NaID) (0.0 Å for Seyfert 1's and 2.2 Å for Seyfert 2's) than that of others (3.2 Å for HII galaxies, 4.2 Å for mixture types and 5.6 Å for LINERs). LINERs and mixture types have larger NaID absorption than HII galaxies. Both E(B-V) and EW(NaID) show that Seyfert 1s have less dust and LINER-like galaxies show more dust than that of HII galaxies. Figure 5 is a plot of EW(NaID) versus E(B-V) for different types of VLIRGs. Seyfert 1's have the lowest E(B-V) and EW(NaID) values, indicating that they are not much affected by dust. For HII galaxies, there is a significant correlation between the E(B-V) and EW(NaID); the probability that the correlation is fortuitous is 0.015. supports the interstellar origin of NaID absorption. Similar correlations exist among other dust indicators for HII galaxies (Figs. 6 and 7): the probability of no-correlation between C6563/C4861 and E(B-V) for HII galaxies is 0.0016, and that between C6563/C4861 and EW(NaID) is 0.02. These strong correlations indicate that all three reddenings have a similar origin and HII galaxies have a simple nuclear structure. However the statistical tests do not show significant correlations among the three reddening indicators for the LINER-like galaxies and Seyfert 2's. This indicates that the line and continuum emission may come from different regions in the nuclei, and the nuclear or circumnuclear regions are much complex compared with those of HII galaxies.
  
\begin{figure}
{
\psfig {figure=DS1477FIG5.ps,height=7.0cm,width=6.50cm,angle=270}
}\end{figure} 
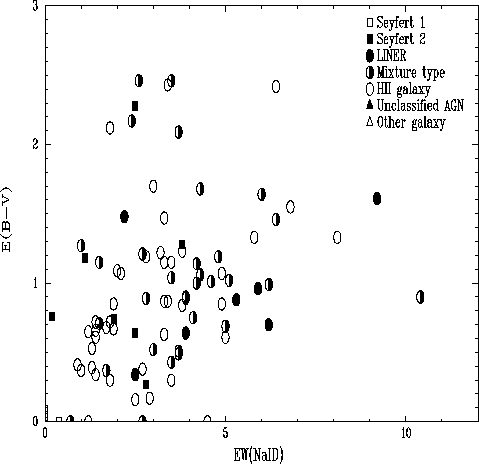
Figure 5: Color excess as a function of the equivalent width of the NaID line for each spectral type. The meaning of each symbol is shown in the up-right of the plot. In the following figures, all the symbols have the same meanings

2.6 $\rm H\alpha$ emission

As an indicator of star formation, $\rm H\alpha$ emission is clearly quite important.
  
\begin{figure}
{
\psfig {figure=DS1477FIG6.ps,height=7.0cm,width=6.50cm,angle=270}
}\end{figure} Figure 6: Color excess as a function of the observed ratio of the continuum at 6563 Å and 4861 Å for each spectral type
Figure 8 shows the distribution of equivalent width of $\rm H\alpha$for different types of galaxies. The median EW($\rm H\alpha$) are 197 Å, 89 Å, 35 Å, 34 Å and 55 Å for Seyfert 1s, Seyfert 2s, LINERs, mixture types and HII galaxies respectively.
  
\begin{figure}
{
\psfig {figure=DS1477FIG7.ps,height=8.0cm,width=6.50cm,angle=270}
}\end{figure} Figure 7: Observed continuum color ratio C6563/C4861 as a function of the equivalent width of NaID for each spectral type
It is clear that the Seyfert galaxies have the strongest $\rm H\alpha$ emission, and LINER-like galaxies the weakest. We found that the LINER and mixture type of galaxies have similar median value of EW($\rm H\alpha$). K-S tests show that, among the five types, only LINERs and mixture types could come from the same population (the K-S probability is 0.996). It indicates that these two types have similar $\rm H\alpha$ emission properties. therefore, it is reasonable to combine them as a LINER-like type as we have used in Sect. 2.4 (see also Sect. 4.2).
next previous
Up: A statistical study of galaxies

Copyright The European Southern Observatory (ESO)