

Up: Flux density monitoring of
Subsections
In Table 1 we have listed the sources monitored and the epoch of
observations. Table 2 contains the peak flux densities and the calculated
errors. Table 2 is available only in electronic form at the CDS, Strasbourg via
anonymous ftp 130.79.128.5 or via http://cdsweb.u-strasbg.fr/Abstract.html.
In Table 2 we list the day of the observation, the frequency, peak flux density
and error. The peak flux has been calculated from the Gaussian fit of the
two orthogonal scans observed and is corrected for residual pointing errors
of the telescope. The pointing corrected amplitudes are derived for each scanning
direction independently and are averaged. The error includes uncertainties from the
Gaussian fit parameters and the pointing results. The maximum error from both
results is taken for the averaged amplitude. We convert the data into flux densities
by using the mean of scaling factors found from all the observed calibrators during
an observing session. We used the maximum and minimum of all these scaling
factors and add the resulting flux density changes to the error. By this approach
the resulting error includes a number of time dependent effects like changes in
opacity, focal changes or gain variations of the antenna during an observing run.
To take these effects into account is of particular importance when variability is
under investigation. We note, however, that the errors resulting by our approach are
systematically higher than those quoted from other flux density monitoring
programs.
Our sample includes two radio sources which have not been taken as
identification for the respective  -ray sources in the EGRET
catalogues, but included in the list of Kanbach (1996). The association of 0738+549 with
2EG J0744+5438 has already been pointed out by Mukherjee et al. (1995).
We also regard 0214+108 as a likely identification for 2EG J0216+1107.
In Figs. 2 and 3 we show likelihood finemaps of both
  -ray sources
(taken from Thompson et al. 1995) with
the position of the radio source indicated. Both radio sources have also
been listed as potential EGRET sources by Mattox et al. (1997) who used
Bayesian statistics to evaluate the probability for a correct
cross-identification of
  -ray and radio sources.
A few examples of radio and  -ray light curves are shown for 0235+164 (Fig. 1),
0738+545 (Fig. 4), 3C 279 (Fig. 5) and 1611+343 (Fig. 6) in order to illustrate
the rather different variability behaviour of sources in the sample.
In general, the sampling of the
  -ray light curve is rather coarse if compared to the radio
light curves and much short-term variability remains undetected. This needs to be
taken into account when comparing the variability behaviour in both wavelength ranges.
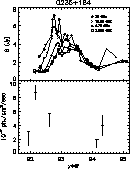 |
Figure 1:
Radio and  -ray lightcurves for 0235+164 -ray lightcurves for 0235+164 |
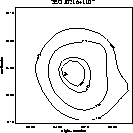 |
Figure 2:
Proposed identification of 0214+108 (marked by a star) with the  -ray source
2EG J0216+1107. The contours represent the statistical probability that a single
source lies within the given contour -ray source
2EG J0216+1107. The contours represent the statistical probability that a single
source lies within the given contour |
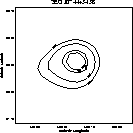 |
Figure 3:
Proposed identification of 0738+545 (marked by a star) with the  -ray source
2EG J0744+5438. The contours represent the statistical probability that a single
source lies within the given contour -ray source
2EG J0744+5438. The contours represent the statistical probability that a single
source lies within the given contour |
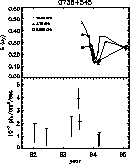 |
Figure 4:
Radio and  -ray lightcurves for 0738+545. The radio source shows
remarkable spectral changes on short time scales -ray lightcurves for 0738+545. The radio source shows
remarkable spectral changes on short time scales |
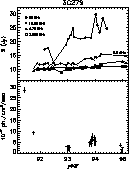 |
Figure 5:
Radio and  -ray lightcurves for 3C 279 -ray lightcurves for 3C 279 |
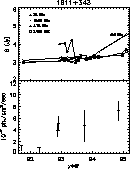 |
Figure 6:
Radio and  -ray lightcurves for 1611+343 -ray lightcurves for 1611+343 |
Table 3:
Single measurements
 |
We have added observations of MKN 501 in Table 1 which has not been identified as
an EGRET source but
has recently been seen at TeV  -ray energies with the Whipple Cherenkov
telescope (Quinn et al. 1996) or the HEGRA Cherenkov telescope
(Bradbury et al. 1997). Also data for 3C 345 are included, since its strength in flux
density and its high variability make it a potential
  -ray source candidate.
In Table 3 we list flux densities for six sources which have been observed
once. Most of the data are from a program to observe
quasi simultaneously the spectra
of radio sources with soft X-rays counterparts as revealed by ROSAT (Reich et al., in preparation).
We note that most of the sources listed in Table 1 are visible in the ROSAT all-sky survey.


Up: Flux density monitoring of
Copyright The European Southern Observatory (ESO)
![]() -ray light curves are shown for 0235+164 (Fig. 1),
0738+545 (Fig. 4), 3C 279 (Fig. 5) and 1611+343 (Fig. 6) in order to illustrate
the rather different variability behaviour of sources in the sample.
In general, the sampling of the
-ray light curves are shown for 0235+164 (Fig. 1),
0738+545 (Fig. 4), 3C 279 (Fig. 5) and 1611+343 (Fig. 6) in order to illustrate
the rather different variability behaviour of sources in the sample.
In general, the sampling of the ![]() -ray light curve is rather coarse if compared to the radio
light curves and much short-term variability remains undetected. This needs to be
taken into account when comparing the variability behaviour in both wavelength ranges.
-ray light curve is rather coarse if compared to the radio
light curves and much short-term variability remains undetected. This needs to be
taken into account when comparing the variability behaviour in both wavelength ranges.
