(1)
First, in some ![]() -ray selected blazars it has been established that
-ray selected blazars it has been established that ![]() -ray flaring coincides
with the launching of a new superluminal VLBI-jet component (e.g.
Pohl et al. 1995;
Krichbaum et al. 1995), and measuring the time delay between
-ray flaring coincides
with the launching of a new superluminal VLBI-jet component (e.g.
Pohl et al. 1995;
Krichbaum et al. 1995), and measuring the time delay between ![]() -ray flaring and radio
appearance provides valuable information about the jet component formation, collimation
and acceleration processes.
-ray flaring and radio
appearance provides valuable information about the jet component formation, collimation
and acceleration processes.
(2)
Secondly, ![]() -ray loud AGN could contribute a large fraction of the
diffuse extragalactic
-ray loud AGN could contribute a large fraction of the
diffuse extragalactic ![]() -ray background radiation due to the superposition
of unresolved discrete sources. Most approaches
(Erlykin & Wolfendale 1995;
Stecker & Salamon 1996) relate the unknown
-ray background radiation due to the superposition
of unresolved discrete sources. Most approaches
(Erlykin & Wolfendale 1995;
Stecker & Salamon 1996) relate the unknown ![]() -ray luminosity function of blazars to
their radio luminosity function, and the justification of such proportionalities
can only be tested by observing individual bright
-ray luminosity function of blazars to
their radio luminosity function, and the justification of such proportionalities
can only be tested by observing individual bright ![]() -ray loud and quiet radio AGN.
-ray loud and quiet radio AGN.
(3) Different theoretical models of the time and spectral evolution of flaring blazars make definite predictions about the onset of flares in different frequency bands, so that multifrequency broadband modelling provides an excellent test data set to discriminate quantitatively between different models.
A statistical analysis of the radio properties of EGRET sources and specifically
the relation between radio and ![]() -ray emission has been published elsewhere
(Mücke et al. 1996, 1997). It was found that those flat-spectrum radio sources
which have been detected by EGRET also show more activity at cm radio
wavelengths than similar sources which remain
-ray emission has been published elsewhere
(Mücke et al. 1996, 1997). It was found that those flat-spectrum radio sources
which have been detected by EGRET also show more activity at cm radio
wavelengths than similar sources which remain ![]() -ray quiet during the last years.
However, there is no direct correlation between the radio and
-ray quiet during the last years.
However, there is no direct correlation between the radio and ![]() -ray light curves,
neither in flux density nor in luminosity. Previous findings of a strict relation in
luminosity can be entirely explained by the limited dynamical range of the EGRET
data and selection effects inherent in the method of identification. The fact that
about one third of the sources listed in Thompson et al. (1995) can be identified
with radio-loud AGN with catalogue flux densities of
-ray light curves,
neither in flux density nor in luminosity. Previous findings of a strict relation in
luminosity can be entirely explained by the limited dynamical range of the EGRET
data and selection effects inherent in the method of identification. The fact that
about one third of the sources listed in Thompson et al. (1995) can be identified
with radio-loud AGN with catalogue flux densities of ![]() indicates that there is a noisy luminosity relation which is further
washed out by the strong variability both in
indicates that there is a noisy luminosity relation which is further
washed out by the strong variability both in ![]() -rays and at radio frequencies.
-rays and at radio frequencies.
A time lag between ![]() -ray and radio outbursts was suggested
for some sources on the basis of their light curves (e.g. Paper I)
and the backextrapolation of the apparent motion of VLBI components.
It should, however, be pointed out that there is no statistical evidence for this
as a class property of all sources, which is mainly due to the limited sampling
of the
-ray and radio outbursts was suggested
for some sources on the basis of their light curves (e.g. Paper I)
and the backextrapolation of the apparent motion of VLBI components.
It should, however, be pointed out that there is no statistical evidence for this
as a class property of all sources, which is mainly due to the limited sampling
of the ![]() -ray light curve. Many of the promising candidates for a time lag in Paper I
showed only one clear outburst in each wavelength regime (for example the
BL Lac 0235+164, see Fig. 1). When adding more data from subsequent observations
we get a less clear picture for some sources. An example is PKS 0528+134 which
showed a
-ray light curve. Many of the promising candidates for a time lag in Paper I
showed only one clear outburst in each wavelength regime (for example the
BL Lac 0235+164, see Fig. 1). When adding more data from subsequent observations
we get a less clear picture for some sources. An example is PKS 0528+134 which
showed a ![]() -ray outburst in 1991 followed by a radio outburst, another bright
-ray outburst in 1991 followed by a radio outburst, another bright ![]() -ray outburst
in 1993 again followed by a radio outburst, and then nothing peculiar at
-ray outburst
in 1993 again followed by a radio outburst, and then nothing peculiar at ![]() -rays in 1995
while subsequently the brightest ever recorded radio outburst was noted
(Pohl et al.
1996). Our findings indicate that if there is a time lag between
-rays in 1995
while subsequently the brightest ever recorded radio outburst was noted
(Pohl et al.
1996). Our findings indicate that if there is a time lag between ![]() -ray and radio outbursts
then it has to be different from outburst to outburst, at least for the well-sampled
sources 0528+134, 3C 273, 3C 279, and 3C 454.3 (Mücke et al. 1998).
-ray and radio outbursts
then it has to be different from outburst to outburst, at least for the well-sampled
sources 0528+134, 3C 273, 3C 279, and 3C 454.3 (Mücke et al. 1998).
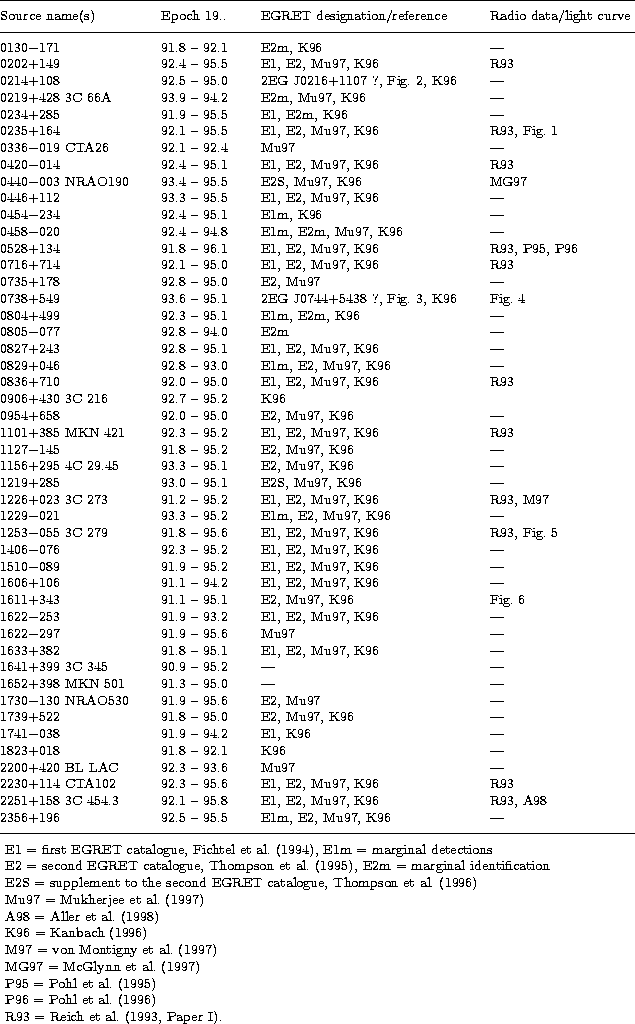
We have continued the observations presented in Paper I with the Effelsberg
100-m telescope of EGRET detected ![]() -ray sources and in addition we made observations
of a few sources which have been expected to show up in the
-ray sources and in addition we made observations
of a few sources which have been expected to show up in the ![]() -ray range.
For most of the sources observations have been made at irregular intervals
starting in 1991 until mid of 1995. For a few sources flux density monitoring
was continued until February 1996 when all observations stopped due to the
track replacement of the telescope. The results of the observations are presented
in tabulated form and for a few sources light curves are given in addition. For some
sources radio light curves or data from Table 1 have already been published. We
have included the references in Table 1.
-ray range.
For most of the sources observations have been made at irregular intervals
starting in 1991 until mid of 1995. For a few sources flux density monitoring
was continued until February 1996 when all observations stopped due to the
track replacement of the telescope. The results of the observations are presented
in tabulated form and for a few sources light curves are given in addition. For some
sources radio light curves or data from Table 1 have already been published. We
have included the references in Table 1.
Copyright The European Southern Observatory (ESO)