The standard photometry presented here satisfies the needs for photographic
photometry calibrations in two fields along the meridian section of the Milky
Way toward the galactic anticenter; the North galactic pole (NGP)
region is centered
at (![]() ,
, ![]() ), and the galactic plane region
(GPR) at (
), and the galactic plane region
(GPR) at (![]() ,
, ![]() ) around the open cluster
STOCK 2.
These fields are part of a systematic study
(which includes a total of twelve regions) aiming at the detailed investigation
of the structural and kinematical properties of the Galaxy
(Spagna et al. 1996, and references therein).
New CCD observations have been obtained to establish sequences of standard
stars in the
) around the open cluster
STOCK 2.
These fields are part of a systematic study
(which includes a total of twelve regions) aiming at the detailed investigation
of the structural and kinematical properties of the Galaxy
(Spagna et al. 1996, and references therein).
New CCD observations have been obtained to establish sequences of standard
stars in the ![]() Johnson-Cousins photometric system,
down to
Johnson-Cousins photometric system,
down to ![]() 18.0 and 18.5, for GPR and NGP respectively.
18.0 and 18.5, for GPR and NGP respectively.
![]() CCD data for the GPR and NGP fields were taken at
Mt. Hopkins using the 1.2 m telescope equipped with a
CCD camera (scale
CCD data for the GPR and NGP fields were taken at
Mt. Hopkins using the 1.2 m telescope equipped with a
CCD camera (scale ![]() /pixel), covering
/pixel), covering ![]() .The GPR, that was observed on October 15 1993,
is centered on star No. 49 from the list of
Krzeminski & Serkowski (1967).
The NGP fields, which were imaged the night of June 5 1994,
are located respectively to the center (I), the North-East (II) and North-West
(III)
edges of the NGP region on the photographic plates we tackled.
The center coordinates of all the fields are reported in Table 1.
.The GPR, that was observed on October 15 1993,
is centered on star No. 49 from the list of
Krzeminski & Serkowski (1967).
The NGP fields, which were imaged the night of June 5 1994,
are located respectively to the center (I), the North-East (II) and North-West
(III)
edges of the NGP region on the photographic plates we tackled.
The center coordinates of all the fields are reported in Table 1.
The CCD frames were reduced utilizing standard packages; bias subtraction and flat-field corrections were handled with MIDAS (Grøsbol & Ponz 1985), and image centering and instrumental magnitudes with DAOPHOT 2.0 in MIDAS (Stetson 1987). The final transformations, including extinction correction and color transforms to the Johnson-Cousins standard system, were done with a version of the code SNOPY developed at ESO, properly modified to run on CCD data by Pizzuti (1991) and Mitton (1992).
The average precision of the standard sequences derived here
is, for both regions, better than 0.05 mag for V, B-V, and ![]() .
.
These photoelectric standards are all too bright (![]() ) for a direct calibration
of the frames down to
) for a direct calibration
of the frames down to ![]() . To bridge the magnitude gap,
we took frames of
different exposures (1, 2, 10, 60 s in R; 2, 4, 20, 120 s in V;
4, 8, 40,
240 s in B) using field stars as standards for the deeper frames.
Krzeminski and Serkowski
only provide UBV photometry. Therefore,
. To bridge the magnitude gap,
we took frames of
different exposures (1, 2, 10, 60 s in R; 2, 4, 20, 120 s in V;
4, 8, 40,
240 s in B) using field stars as standards for the deeper frames.
Krzeminski and Serkowski
only provide UBV photometry. Therefore, ![]() magnitudes
of the bright photometric calibrators were computed
from spectral types, E(B-V), and V magnitudes as given in
Krzeminski & Serkowski (1967),
the
magnitudes
of the bright photometric calibrators were computed
from spectral types, E(B-V), and V magnitudes as given in
Krzeminski & Serkowski (1967),
the ![]() intrinsic colors from Table 7 (p. 311) of
Straizys (1992), and the ratios
of red to blue reddening
intrinsic colors from Table 7 (p. 311) of
Straizys (1992), and the ratios
of red to blue reddening ![]() as published by Taylor
(1986); these are summarized in Table 2.
as published by Taylor
(1986); these are summarized in Table 2.
The experimental color equations we found, which transform the CCD magnitudes b, v, and r into the standard ones, are:
 |
(1) | |
| (2) | ||
| (3) |
 |
(4) | |
| (5) | ||
| (6) |
As an external check on the accuracy of these results, and in particular on
that of
the ![]() color (being based
on synthetic red magnitudes), we looked
at the
color (being based
on synthetic red magnitudes), we looked
at the ![]() vs. (B-V) plot of the derived colors.
Figure 1 shows
these colors (dots) superimposed to the main sequence (solid line)
obtained using the intrinsic
vs. (B-V) plot of the derived colors.
Figure 1 shows
these colors (dots) superimposed to the main sequence (solid line)
obtained using the intrinsic ![]() color data as given
in Straizys (1992).
Apart from the expected shift
along the curve defined by the intrinsic colors,
due to the strong interstellar absorption in this field (AV =
4.0 mag/kpc),
the observed colors have
practically the same slope as that defined by the intrinsic colors.
Again, this was expected as the selective reddening ratio
color data as given
in Straizys (1992).
Apart from the expected shift
along the curve defined by the intrinsic colors,
due to the strong interstellar absorption in this field (AV =
4.0 mag/kpc),
the observed colors have
practically the same slope as that defined by the intrinsic colors.
Again, this was expected as the selective reddening ratio
![]() is about the same
as the natural slope of the intrinsic color sequence, and it shows that
the
is about the same
as the natural slope of the intrinsic color sequence, and it shows that
the ![]() calibration is consistent
with the observed B and V magnitudes.
Any systematic effect on the red magnitudes would manifest itself
as a translation along the
calibration is consistent
with the observed B and V magnitudes.
Any systematic effect on the red magnitudes would manifest itself
as a translation along the ![]() axis.
axis.
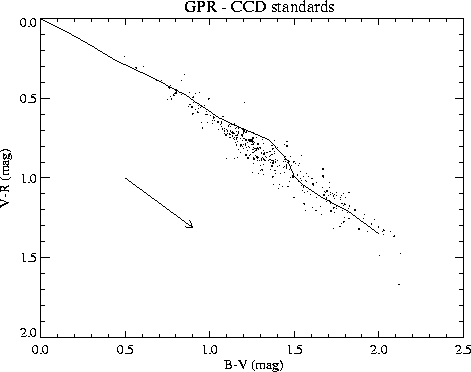 |
Figure 1: GPR. Two-color diagram. The points show the colors as derived from the CCD data. The solid line represents the intrinsic colors of Straizys (1992), and the arrow the slope of the reddening |
For each of the three CCD fields imaged in the direction of the NGP region,
we proceeded in a way similar to that adopted for the GPR region.
To bridge the magnitude range needed for a proper calibration of the
photographic photometry, we took four series of exposures for each bandpass
used: 1, 2, 10, 60 s in ![]() , 2, 4, 20, 120 s in V, and 4, 8, 40,
240 s in B.
, 2, 4, 20, 120 s in V, and 4, 8, 40,
240 s in B.
The low star density and a noticeable variation of the telescope point-spread-function (PSF) across the chip suggested the use of aperture photometry, instead of PSF fitting (which was the method of choice for the low latitude field) for the derivation of the instrumental magnitudes. In particular, we used the growth curve technique (Stetson 1990; Da Costa 1992) for the determination of the optimal software aperture.
The transformation to the standard Johnson-Cousins system was done via the
usual method of observing a set of primary photometric standard stars
at different air masses throughout the same night.
Stars![]() from Landolt (1992) in the magnitude range
from Landolt (1992) in the magnitude range
![]() , and in the color ranges
, and in the color ranges
![]() ,
,
![]() , were used.
, were used.
The best-fit to the color equations![]() provided:
provided:
 |
(7) | |
| (8) | ||
| (9) |
The final list of faint photometric standard stars was derived from the second and fourth exposures. In the magnitude range covered by both exposures, proper averaging was applied.
 |
Figure 2: NGP. Two-color diagram. Crosses, triangles and diamonds show the colors as derived from the CCD data for the central (I), North-East (II) and North-West (III) fields. The solid line represents the intrinsic colors of Straizys (1992) |
As for the GPR, Fig. 2 shows the color-color plot for the
NGP field with superimposed Straizys' unreddened main sequence. Besides the
reliability of the photometric calibration, this plot confirms the
predicted low reddening along this line of sight.
(Visual inspection of the image shows that the
outlier with ![]() and
and ![]() is a suspected double
object and is not listed in the final table.)
is a suspected double
object and is not listed in the final table.)
Here, the CCD-based standard colors have been corrected for an offset
of -0.04 and +0.05 mag in (B-V) and ![]() respectively.
These offsets can be interpreted as the expected effect of the
zero point errors in the transformation from instrumental to
standard magnitude and colors.
The correction on B-V was inferred from
comparisons with independent UBV photometric catalogs
(see Spagna et al. 1996 for details).
The
respectively.
These offsets can be interpreted as the expected effect of the
zero point errors in the transformation from instrumental to
standard magnitude and colors.
The correction on B-V was inferred from
comparisons with independent UBV photometric catalogs
(see Spagna et al. 1996 for details).
The ![]() correction was derived directly from the color-color
diagram, as the shift which best matches the observed
and theoretical sequences.
correction was derived directly from the color-color
diagram, as the shift which best matches the observed
and theoretical sequences.
Copyright The European Southern Observatory (ESO)

