The envelope central positions adopted to perform the 12CO(![]() ) observations are those reported by Loup et al. 1993. Due to pointing
uncertainties and to the shift-and-add technique used to combine
several maps, discrepancies between these coordinates and the actual
map centers are meaningless. In the position-velocity diagrams,
however, the zero position of the 12CO(
) observations are those reported by Loup et al. 1993. Due to pointing
uncertainties and to the shift-and-add technique used to combine
several maps, discrepancies between these coordinates and the actual
map centers are meaningless. In the position-velocity diagrams,
however, the zero position of the 12CO(![]() ) maps is chosen to correspond
to the maximum of the 12CO(
) maps is chosen to correspond
to the maximum of the 12CO(![]() ) emission.
) emission.
The 12CO(![]() ) main beam temperature
) main beam temperature ![]() reported in the parameter
summary of each envelope and in Table 4 is the average of the three
central 1MHz channels in the spectral profile observed towards the
envelope center. Channels affected by a galactic CO contribution have
been omitted.
reported in the parameter
summary of each envelope and in Table 4 is the average of the three
central 1MHz channels in the spectral profile observed towards the
envelope center. Channels affected by a galactic CO contribution have
been omitted.
The flux density reported in the summary and in Table 4 is the average
value of the three central channels in the spatially integrated 12CO(![]() ) spectral profile S(v) of each envelope. The integrated flux density
profile has been obtained by adding the spectra with a uniform weight
on a regular grid with a spacing d. The flux spectrum in Jy is given
by
) spectral profile S(v) of each envelope. The integrated flux density
profile has been obtained by adding the spectra with a uniform weight
on a regular grid with a spacing d. The flux spectrum in Jy is given
by
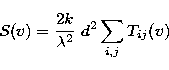 |
(1) |
where Tij(v) is the main beam temperature observed at velocity v and positions (i,j), and where the grid spacing d expressed in radians is either 7.5'' or 5'' depending on the map, and k is the Boltzmann constant.
A comparison of the spatially integrated flux spectrum S(v) with the flux spectrum collected in the telescope beam towards the envelope central position, S0(v), allows comparison of the envelope extent with the beam size: if both fluxes coincide, the envelope is unresolved by the telescope beam. For a gaussian beam of half power beam width h (in radians), the relation between the main beam temperature profile T00(v) observed towards the envelope center and the flux spectrum in the central beam S0(v) is
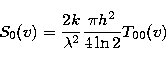 |
(2) |
which is equivalent to a conversion factor of 7.35Jy/K for the
12CO(![]() ) line observed at the 30 m telescope. Both flux spectra,
integrated S(v) and central S0(v) are plotted for comparison for
each envelope (see Atlas). The 30 m telescope half power beam width at
230GHz, was estimated to be 13
) line observed at the 30 m telescope. Both flux spectra,
integrated S(v) and central S0(v) are plotted for comparison for
each envelope (see Atlas). The 30 m telescope half power beam width at
230GHz, was estimated to be 13![]()
![]() 1.5
1.5![]() , including beam
smearing effects due to tracking errors.
, including beam
smearing effects due to tracking errors.
We also give in Table 4 the total 12CO(![]() ) emission of the envelope
(i.e. the flux integrated both spatially and over velocity).
) emission of the envelope
(i.e. the flux integrated both spatially and over velocity).
The star systemic velocity ![]() and the envelope expansion
velocity
and the envelope expansion
velocity ![]() have been derived from the full width at zero
level (FWZL) of the 12CO(
have been derived from the full width at zero
level (FWZL) of the 12CO(![]() ) lines. To minimize the effect of noise on
the derivation of the FWZL, we have defined as the extreme line
channels those for which the 20% to 90% intensity contours still
show a centrally peaked pattern. The resulting velocities are given
in the parameters list of each envelope and in Table 4. The errors are
typically one channel half-width (1.3kms-1 for most envelopes,
0.7kms-1 for the 8 narrow line envelopes mentioned above).
) lines. To minimize the effect of noise on
the derivation of the FWZL, we have defined as the extreme line
channels those for which the 20% to 90% intensity contours still
show a centrally peaked pattern. The resulting velocities are given
in the parameters list of each envelope and in Table 4. The errors are
typically one channel half-width (1.3kms-1 for most envelopes,
0.7kms-1 for the 8 narrow line envelopes mentioned above).
We must keep in mind that this calculation of the expansion velocity tends to overestimate the true value of this parameter when the line profiles present conspicuous wings, the origin of which is expected to be related to local velocity dispersion or to the presence of bipolar outflows independent of the general envelope expansion. Fitting a truncated parabola systematically leads in such cases to lower estimates of the expansion velocity. This discrepancy can be significant in stars with low expansion velocities. In particular for objects in which the emission of the bipolar outflows is dominant, the meaning of an expansion velocity determined in this way, is just the maximal projection on the light of sight of the axial velocity.
Most envelopes present sharp-edged and round-topped lines, as expected
for optically thick emission coming from a spherically expanding
envelope. In a few cases (OH127.8+0.0, U Cam, S Cep IRC+60427) an
interstellar 12CO(![]() ) contribution appears as a narrow peak or dip in
the spectrum. As far as the signal to noise ratio of the data allows
to conclude, some envelopes show ``unusual'' line shapes, with wings
or shoulders, which suggest changes in the mass loss activity of these
stars (see for instance U Cam, T Dra, RS Cnc and M1-92).
) contribution appears as a narrow peak or dip in
the spectrum. As far as the signal to noise ratio of the data allows
to conclude, some envelopes show ``unusual'' line shapes, with wings
or shoulders, which suggest changes in the mass loss activity of these
stars (see for instance U Cam, T Dra, RS Cnc and M1-92).
To derive a more quantitative estimate of the envelope size in the
12CO(![]() ) line, we have fitted as a function of the velocity channel a 2D
gaussian to the observed spatial distribution. Plots of the fitted
minor and major axis (without beam deconvolution) and of the centroid
shifts relative to the mean centroid position are shown for each
envelope as a function of the channel velocity.
) line, we have fitted as a function of the velocity channel a 2D
gaussian to the observed spatial distribution. Plots of the fitted
minor and major axis (without beam deconvolution) and of the centroid
shifts relative to the mean centroid position are shown for each
envelope as a function of the channel velocity.
In a spherical expanding envelope with a constant (or monotonically
increasing) radial velocity, the radius of the region emitting at a
given radial velocity Vz or -Vz with respect to the systemic
velocity is proportional to ![]() . A decrease
of this radius with the absolute value of Vz is, therefore,
expected. As shown in the figures, such a behaviour is indeed observed
in most sources, although the uncertainties in the measured size is
high.
. A decrease
of this radius with the absolute value of Vz is, therefore,
expected. As shown in the figures, such a behaviour is indeed observed
in most sources, although the uncertainties in the measured size is
high.
Once deconvolved from the telescope beam (h), the fitted major and
minor (M and m) axes averaged over the three central channel maps
provide a measure of the envelope size (L and l)
| (3) |
and a quantitative estimate of its asymmetry, given by the parameter
| f = (L-l)/(L+l). | (4) |
We have carried out a worst-case beam deconvolution to filter out
envelopes with intrinsic elliptical shapes and mask out those whose
asymmetry is possibly due to beam distortion. For this deconvolution,
the telescope beam was assumed to be elliptical (![]() ) and its position angle was made to coincide with the position
angle of the gaussian fit. This deconvolution provides a lower limit
) and its position angle was made to coincide with the position
angle of the gaussian fit. This deconvolution provides a lower limit
![]() to the actual envelope major axis and an upper limit
to the actual envelope major axis and an upper limit
![]() to its actual minor axis. We have then performed a
conservative selection of the ``non-spherical'' envelopes, considering
that any real departure from circular symmetry shows up even in the
lower limit to the asymmetry parameter
to its actual minor axis. We have then performed a
conservative selection of the ``non-spherical'' envelopes, considering
that any real departure from circular symmetry shows up even in the
lower limit to the asymmetry parameter ![]() given by
given by
| (5) |
When ![]() is lower than 0.1, which corresponds to a difference
smaller than 20% between the axis limits, or when the sizes L and
l are not determined with better accuracy than 5
is lower than 0.1, which corresponds to a difference
smaller than 20% between the axis limits, or when the sizes L and
l are not determined with better accuracy than 5![]() , the
envelope is considered as spherical. We choose such a highly
conservative limit to rule out any asymmetry due to possible
uncertainties in the determination of the telescope beam or of the
envelope sizes. In such a case, we give a single size in the
identification panel of each star and in Table 5, which is the average
of the fitted axes deconvolved by a circular beam of width h=13''
, the
envelope is considered as spherical. We choose such a highly
conservative limit to rule out any asymmetry due to possible
uncertainties in the determination of the telescope beam or of the
envelope sizes. In such a case, we give a single size in the
identification panel of each star and in Table 5, which is the average
of the fitted axes deconvolved by a circular beam of width h=13''
| (6) |
Otherwise, the envelope is considered as asymmetric. Table 5 contains the envelope deconvolved minor l and major L axis (assuming a circular beam h) and the resulting asymmetry parameter f.
In addition, the plot of the envelope emission centroid versus
velocity provides informations on the geometry and kinematics: for a
spherically expanding envelope the centroid is expected to keep the
same position at any velocity. On the other hand, if there is
departure from overall spherical symmetry, the centroid is expected to
move along an axis of symmetry. This behaviour is particularly obvious
for RS Cnc, M1-92 and R Cas but exists also possibly for a few other
envelopes, namely for Y CVn, ![]() Cyg, T Cep, IRC+40540 and
IRC+60427.
Cyg, T Cep, IRC+40540 and
IRC+60427.
Copyright The European Southern Observatory (ESO)