In this section we briefly touch upon the global characteristics of the
spectrum. The spectrum is dominated by absorption and emission lines of
neutral and singly ionized Fe, TiII, CrII as well as NI, OI, SiII, and the high order hydrogen recombination
lines of the Balmer and Paschen series. We also identify a weak line at
![]() 5875 with HeI. All lines are broad, especially the
asymmetric and red-shifted absorption lines have FWHM values of
order 1 Å.
5875 with HeI. All lines are broad, especially the
asymmetric and red-shifted absorption lines have FWHM values of
order 1 Å.
In 1973, Humphreys et al. (1973) determined the spectral type of IRC+10420\ as F8Ia+. The late spectral type was based on the presence of the G-band in the spectrum, the high luminosity was based on the strong OI triplet at 7774 Å. The present spectrum of IRC+10420 does not agree with an F8 classification; the lack of neutral lines and the presence of a helium line certainly suggest an earlier spectral type. In Paper I we investigated the spectral energy distribution of IRC+10420, and found changes in the photometry over the last 20 years. During this epoch the V band magnitude remained essentially constant, while the (V - J) and (V - K) colours changed by 0.75 magnitudes. These colour changes were explained as the result of an increase of the photospheric temperature of about 1000 K. The presence of HeI absorption confirms that the spectral type is earlier than F8. A new determination of the spectral type is thus warranted. This poses a problem in the case of IRC+10420. Normal classification criteria use line ratios that are based on lower resolution spectra, where the effects of blended lines are taken into account. In the case of IRC+10420, the emission lines do not provide the best basis for such a procedure. In addition, the large number of emission lines makes comparison with lower resolution standard spectra very difficult. New spectral classification criteria and/or a new catalog of spectral standard stars based on higher resolution spectra would be desirable.
In the course of our study of IRC+10420 and other studies with the UES we
have collected some spectra of standard stars which we will use here to
make a crude estimate of the spectral type of IRC+10420. During the
observations of IRC+10420 for this paper we observed HR 7796 (F8I) and
![]() Cyg (A2I) as comparison. The F supergiants HR 1017 (F5I) and
HR 1865 (F0I) were observed for another study (Oudmaijer & Bakker
1994). The overlapping part of the spectra of these four objects was
limited to the wavelength range 4690 - 4935 Å. The spectra of these
4 stars and that of IRC+10420 are plotted in Fig. 1 (click here). Despite the
small wavelength coverage, the differences between the spectra are
significant; The F type stars show a large number of (neutral)
absorption lines. The neutral lines decrease in strength going from F8
to F0, and are not present in the spectrum of the A2I star, where
H
Cyg (A2I) as comparison. The F supergiants HR 1017 (F5I) and
HR 1865 (F0I) were observed for another study (Oudmaijer & Bakker
1994). The overlapping part of the spectra of these four objects was
limited to the wavelength range 4690 - 4935 Å. The spectra of these
4 stars and that of IRC+10420 are plotted in Fig. 1 (click here). Despite the
small wavelength coverage, the differences between the spectra are
significant; The F type stars show a large number of (neutral)
absorption lines. The neutral lines decrease in strength going from F8
to F0, and are not present in the spectrum of the A2I star, where
H![]() and singly ionized metal lines are present.
and singly ionized metal lines are present.

Figure 1:
UES spectra of IRC+10420 and four spectral standard stars in the wavelength
range 4690 - 4935 Å. Note that the continua of the F supergiants
seem to fluctuate. This is the consequence of difficulties in
normalizing the spectra due to the large number of lines
IRC+10420 best resembles the A2I spectrum, based on the lack of neutral lines, and is intermediate between F0 and A2 as evident from the strength of the strong absorption lines due to Fe and Cr in the spectra. IRC+10420 definitely does not resemble an F8 star. From the comparison of the spectra we conclude that the spectrum of IRC+10420 is intermediate between F0 and A2, and possibly even earlier than A5. This implies that the spectrum of IRC+10420 has changed from F8 in 1973 (Humphreys et al.\ 1973) to A type in 1994. Such a change in spectral type is consistent with the change in the continuum energy distribution (Paper I). During the final stages of the preparation of this paper, some of these data were used for an abundance study by Klochkova et al. (1997), which also points to an increase in temperature, while the abundances appear to be consistent with a massive evolutionary phase of the object.
Apart from the line profiles, the central velocities of the lines show a
marked behaviour, which we will briefly touch upon here. The
systemic velocity of the system is 75 km s-1 as found in the CO rotational
lines in Paper I, which is also measured for the high excitation HeI ![]() 5875 and some high excitation SiII lines.
Surprisingly, there is a large variation in central velocities of the
different types of line. Except for the above mentioned lines,
virtually all absorption lines, including other high excitation lines
due to C, N, and O, are red-shifted by a considerable amount with
respect to the systemic velocity. We also note that the central
velocities of forbidden lines as e.g. presented in Fig. 4 (click here),
are red-shifted (by 10-20 km s-1) from the systemic velocity.
5875 and some high excitation SiII lines.
Surprisingly, there is a large variation in central velocities of the
different types of line. Except for the above mentioned lines,
virtually all absorption lines, including other high excitation lines
due to C, N, and O, are red-shifted by a considerable amount with
respect to the systemic velocity. We also note that the central
velocities of forbidden lines as e.g. presented in Fig. 4 (click here),
are red-shifted (by 10-20 km s-1) from the systemic velocity.
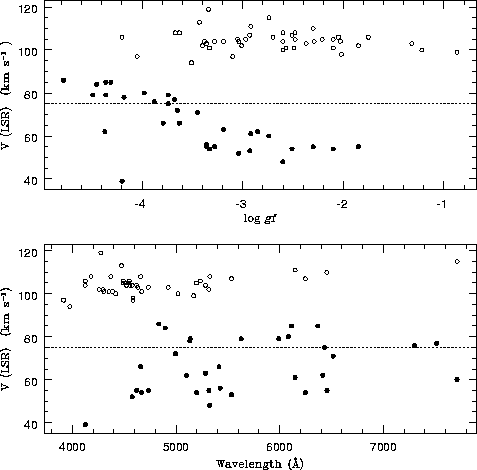
Figure 2:
Relation between the observed central velocities of the FeII lines and
the oscillator strengths (upper panel) and wavelength (lower panel).
The open dots denote the absorption lines, the filled dots represent the
emission lines
In Fig. 2 (click here) we show the relation between the observed peak
velocity of the emission and absorption lines of FeII as function
of oscillator strength. The absorption lines have a constant velocity
of 104 ![]() 5 km s-1 over the entire range of oscillator strength. This
holds for multiplets with only absorption lines and multiplets that have
both emission and absorption lines. The emission lines however show a
different picture. As the absorption strength decreases, the peak
velocities of the lines shift towards the systemic velocity. This
observed correlation between the emission peak-velocities with the
oscillator strength also holds for the other metals as Cr, Ti and Sc,
for which the velocity of the absorption lines is constant with
absorption strength at
5 km s-1 over the entire range of oscillator strength. This
holds for multiplets with only absorption lines and multiplets that have
both emission and absorption lines. The emission lines however show a
different picture. As the absorption strength decreases, the peak
velocities of the lines shift towards the systemic velocity. This
observed correlation between the emission peak-velocities with the
oscillator strength also holds for the other metals as Cr, Ti and Sc,
for which the velocity of the absorption lines is constant with
absorption strength at ![]() 100 km s-1. This is not what one would
expect if the lineprofiles are the result of a superposition of an
emission component centered around the systemic velocity and an
underlying red-shifted photospheric absorption component. In that case,
one would expect that the velocity of the peak of the emission would
shift towards the systemic velocity for a decreasing absorption
strength. This is observed, but one would also expect the absorption
minimum to shift towards larger red-shifts, which is not observed.
Instead, there appears a constant absorption component at +25 km s-1 with
respect to the stellar velocity. Indeed, if (red-shifted) absorption
is superposed on an underlying emission, one can expect the emission
line velocities to change, while the absorption line centers remain at
the same velocity.
100 km s-1. This is not what one would
expect if the lineprofiles are the result of a superposition of an
emission component centered around the systemic velocity and an
underlying red-shifted photospheric absorption component. In that case,
one would expect that the velocity of the peak of the emission would
shift towards the systemic velocity for a decreasing absorption
strength. This is observed, but one would also expect the absorption
minimum to shift towards larger red-shifts, which is not observed.
Instead, there appears a constant absorption component at +25 km s-1 with
respect to the stellar velocity. Indeed, if (red-shifted) absorption
is superposed on an underlying emission, one can expect the emission
line velocities to change, while the absorption line centers remain at
the same velocity.
As a side-result, the lower panel in Fig. 2 (click here) shows the peak velocities as function of wavelength. There is no correlation between the two. This result contradicts the model of Fix (1981) that the red-shift of the photosphere was the result of multiple scattering of photons by circumstellar dust. In this model it is predicted that the line in the blue part of the spectrum are considerably more red-shifted than those at longer wavelengths, which is not seen in our data.
IRC+10420 is a very reddened object, In Paper I we used Kurucz models to fit
the spectral energy distribution of IRC+10420 and found a total E(B-V) towards
IRC+10420 of ![]() 2.4. Of course, it is hard to disentangle the combined
effects of circumstellar and interstellar extinction towards this
objects, but the presence of many strong Diffuse Interstellar Bands
(DIBs) in the absorption spectrum of IRC+10420 may be of help in this
respect. In general, the strength of the DIBs correlates well with the
interstellar reddening (e.g. Herbig 1995), but as early as in
1972, Snow & Wallerstein recognized that in the cases of
mass-losing objects, where a fraction of the extinction may be provided by
the circumstellar rather than interstellar dust, the reddening traced by the
DIBs is significantly lower than the total E(B-V) would imply. The effect
that DIBs trace less than the total reddening has also been seen towards
other types of object, such as T Tauri stars (Meyer & Ulrich
1984), star forming regions (e.g. Adamson et al. 1991)
and massive Young Stellar Objects (Oudmaijer et al. 1997). In
all these cases there is, next to the diffuse ISM, an extra dust component,
either circumstellar material, the molecular cloud material in which these
objects are still embedded or a combination of both, responsible for the
total extinction towards these objects. Although not yet well
understood, this probably means that the physical conditions in the "DIB
deficient" material are apparently such that the DIB carriers have
failed to form, or are not excited in the same abundance and manner, as
in the Interstellar Medium.
2.4. Of course, it is hard to disentangle the combined
effects of circumstellar and interstellar extinction towards this
objects, but the presence of many strong Diffuse Interstellar Bands
(DIBs) in the absorption spectrum of IRC+10420 may be of help in this
respect. In general, the strength of the DIBs correlates well with the
interstellar reddening (e.g. Herbig 1995), but as early as in
1972, Snow & Wallerstein recognized that in the cases of
mass-losing objects, where a fraction of the extinction may be provided by
the circumstellar rather than interstellar dust, the reddening traced by the
DIBs is significantly lower than the total E(B-V) would imply. The effect
that DIBs trace less than the total reddening has also been seen towards
other types of object, such as T Tauri stars (Meyer & Ulrich
1984), star forming regions (e.g. Adamson et al. 1991)
and massive Young Stellar Objects (Oudmaijer et al. 1997). In
all these cases there is, next to the diffuse ISM, an extra dust component,
either circumstellar material, the molecular cloud material in which these
objects are still embedded or a combination of both, responsible for the
total extinction towards these objects. Although not yet well
understood, this probably means that the physical conditions in the "DIB
deficient" material are apparently such that the DIB carriers have
failed to form, or are not excited in the same abundance and manner, as
in the Interstellar Medium.
If one then considers the possibility that the DIB absorption does not, or hardly takes place in the circumstellar envelope of IRC+10420, it may provide a rough value of the interstellar extinction towards the object. This is an important quantity for studies of the spectral energy distribution. In the event that a fraction of the DIB absorption does take place in its circumstellar envelope (see Le Bertre & Lequeux 1993 on such possibilities), we at least obtain a more stringent upper limit to the value of the interstellar reddening.
To this end, we searched the spectrum of IRC+10420 for DIBs listed in the
catalog of JD94. Since the free spectral range of the individual
spectral orders is relatively small, no broad DIBs were found. After
carefully selecting the strongest, least affected lines by blends with
stellar lines, we found 30 DIBs stronger than 20 mÅ. These are
listed in Table 2 (click here). Four DIBs in the spectrum of IRC+10420 have
also been measured by Le Bertre & Lequeux (1993). The
measurements of the narrow ![]() 5780, 5797 bands agree very well
(Le Bertre & Lequeux measured 580 and 270 mÅ respectively), the broad
5780, 5797 bands agree very well
(Le Bertre & Lequeux measured 580 and 270 mÅ respectively), the broad
![]() 6177 measured by them is not visible in our higher resolution
data. The EW of the
6177 measured by them is not visible in our higher resolution
data. The EW of the ![]() 6284 band (2200 Å), is blended with
the much broader
6284 band (2200 Å), is blended with
the much broader ![]() 6281 line and is affected in the same
way. We only measured the weaker
6281 line and is affected in the same
way. We only measured the weaker ![]() 6284 line.
6284 line.
In Table 2 (click here), the EW per unit E(B-V) as determined by JD94 and
their respective ratio (which can be considered as the E(B-V) as traced
by the DIBs) are listed. The scatter in the inferred DIB-E(B-V)\
is fairly large, the unweighted mean and standard deviation is 1.4 ![]() 0.5, yet it is clear that the reddening traced by the DIBs, as in the
cases mentioned above, is smaller than the total reddening to IRC+10420.
Several DIBs appear to trace the total E(B-V). It is not clear however
whether this is due to an enhanced DIB formation efficiency in the
circumstellar material, or whether it is due to the particular line of
sight, as some lines of sight can show a remarkable deviations from the
usual correlations between DIB strength and E(B-V) (Ehrenfreund et al.\
1997). On the whole however, a larger sample of DIBs return
approximately the same correlation value (Herbig 1995; JD94).
0.5, yet it is clear that the reddening traced by the DIBs, as in the
cases mentioned above, is smaller than the total reddening to IRC+10420.
Several DIBs appear to trace the total E(B-V). It is not clear however
whether this is due to an enhanced DIB formation efficiency in the
circumstellar material, or whether it is due to the particular line of
sight, as some lines of sight can show a remarkable deviations from the
usual correlations between DIB strength and E(B-V) (Ehrenfreund et al.\
1997). On the whole however, a larger sample of DIBs return
approximately the same correlation value (Herbig 1995; JD94).
An additional clue to the origin of the DIBs may be provided with
their central velocities. JD94 provide "rest" wavelengths of the DIBs
with their associated errors. We have measured the Doppler shifts for
the lines, which are listed in Table 2 (click here) in the last column.
For some lines, especially the broader ones, it was not possible to
measure the central velocities, and these entries are left blank. The
average velocity, and its standard deviation is 18 ![]() 7 km s-1 (LSR).
Some lines have markedly larger velocities, but the error in the
central wavelength for these lines is large (see JD94). Indeed, when
the 9 lines whose error in rest wavelength is less than 0.1 Å are
selected, we obtain 17
7 km s-1 (LSR).
Some lines have markedly larger velocities, but the error in the
central wavelength for these lines is large (see JD94). Indeed, when
the 9 lines whose error in rest wavelength is less than 0.1 Å are
selected, we obtain 17 ![]() 3 km s-1. This is a blue-shift of
3 km s-1. This is a blue-shift of ![]() 60
km s-1 with respect to the systemic velocity, and even more than 80 km s-1\
from most absorption lines. As the outflow velocity of the
circumstellar material is only 40 km s-1 (Paper I), it seems likely that
the DIBs indeed originate in the ISM in the line of sight instead of
in the circumstellar material.
60
km s-1 with respect to the systemic velocity, and even more than 80 km s-1\
from most absorption lines. As the outflow velocity of the
circumstellar material is only 40 km s-1 (Paper I), it seems likely that
the DIBs indeed originate in the ISM in the line of sight instead of
in the circumstellar material.
From this exercise, we find that the DIB strengths indicate a rough
value of the interstellar E(B-V) towards IRC+10420 of 1.4 ![]() 0.5. The
interstellar nature of the bands is supported by their Local Standard of
Rest velocities, whose offset exceeds that of the stellar outflow
velocity.
0.5. The
interstellar nature of the bands is supported by their Local Standard of
Rest velocities, whose offset exceeds that of the stellar outflow
velocity.
| EW | EW/E(B-V) | ratio | | |
| (Å) | (mÅ) | (mÅ) | (km s-1) | |
| 4727.06 | 150 | 87 | 1.72 | |
| 4762.57 | 75 | 79 | 0.95 | |
| 4963.96 | 26 | 16 | 1.63 | 17 |
| 5766.25 | 30 | 13 | 2.31 | 5 |
| 5780.59 | 540 | 579 | 0.93 | 14 |
| 5797.11 | 240 | 132 | 1.82 | 15 |
| 5844.19 | 150 | 77 | 1.95 | |
| 5849.78 | 110 | 48 | 2.29 | 20 |
| 6004.55 | 25 | 24 | 1.04 | |
| 6089.80 | 45 | 17 | 2.65 | 18 |
| 6196.19 | 70 | 61 | 1.15 | 8 |
| 6203.19 | 150 | 107 | 1.40 | 14 |
| 6284.31 | 650 | 618 | 1.05 | |
| 6367.22 | 22 | 17 | 1.29 | 22 |
| 6376.07 | 40 | 26 | 1.54 | 17 |
| 6379.27 | 155 | 78 | 1.99 | 16 |
| 6449.13 | 45 | 20 | 2.25 | 24 |
| 6597.39 | 25 | 19 | 1.32 | 17 |
| 6613.72 | 260 | 231 | 1.13 | 13 |
| 6660.64 | 60 | 51 | 1.18 | 19 |
| 6699.37 | 40 | 41 | 0.98 | 12 |
| 6919.25 | 40 | 53 | 0.75 | |
| 6993.18 | 105 | 116 | 0.91 | 14 |
| 7060.81 | 40 | 19 | 2.11 | 32 |
| 7062.70 | 25 | 23 | 1.09 | 18 |
| 7334.33 | 30 | 60 | 0.50 | 24 |
| 7366.61 | 45 | 42 | 1.07 | 40 |
| 7562.24 | 70 | 87 | 0.80 | 16 |
| 8026.21 | 40 | 42 | 0.95 | 22 |
| 8037.24 | 30 | 37 | 0.81 | 20 |