
Up: Infrared giants vs.
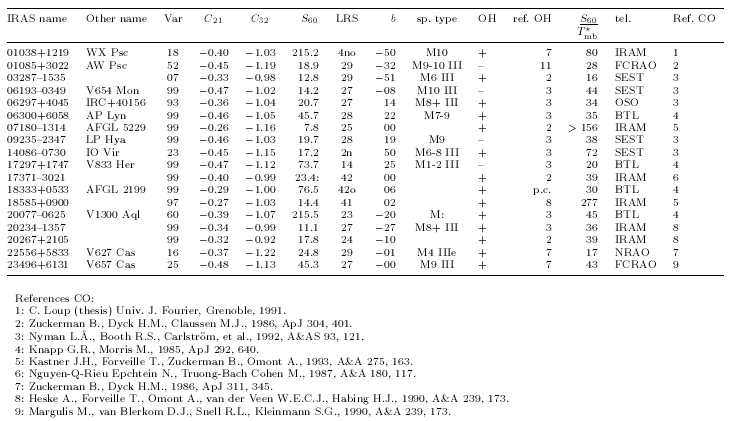
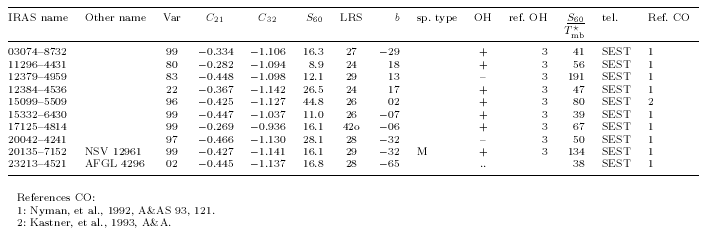
We present here tables that summarize various param-
eters of
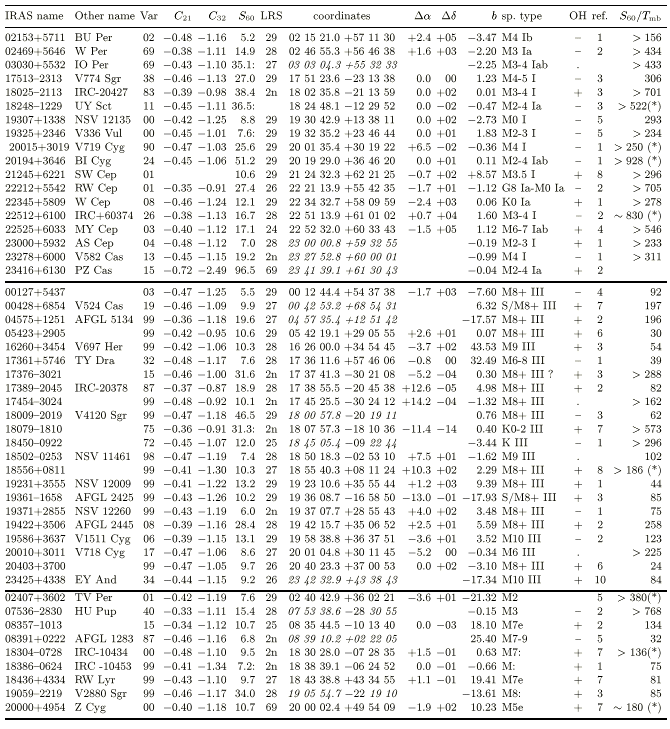
the studied sources: coordinates determined as explained in Sect. 2.2,
IRAS properties (variability, LRS, fluxes), spectral types, OH detections, and
the  ratio. These tables are the basis of the
statistical analysis and are referenced in the text.
The list of objects is divided according to the following: first, the
observations performed before 1994 and published by several authors are
presented, with the  ratio using a
a correction for the surface of the antenna; then, we present our own
observations, starting with the main sample studied here, and continuing with
miscellanous objects.
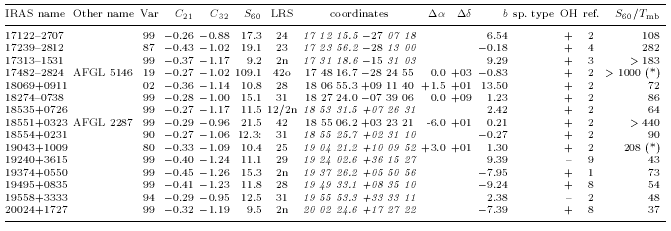
|
Table 9: continued

|
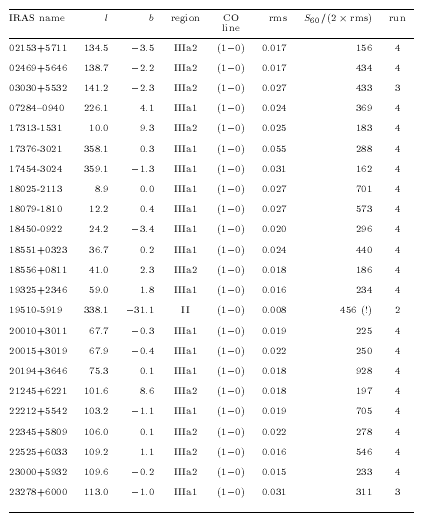
Table 10: Observed O-rich sources from regions IIIa1 or IIIa2,
with 
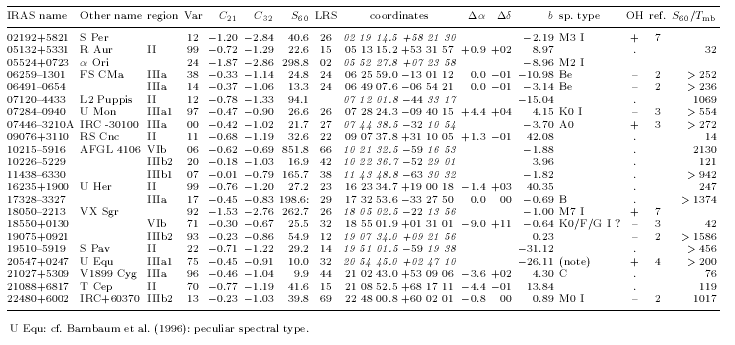
|
Table 11: Other observations (see Sect. 6 for some comments)
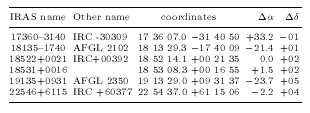
|
Table 12: List of sources seen as strongly contaminated by interstellar CO
emission and/or absorption with no hints of circumstellar CO emission
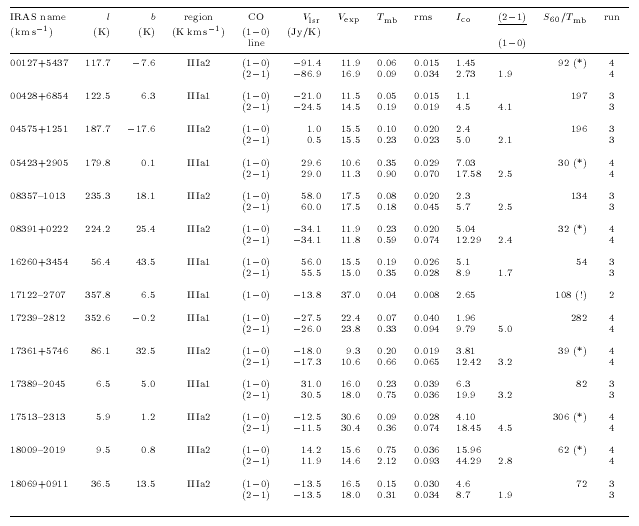
|
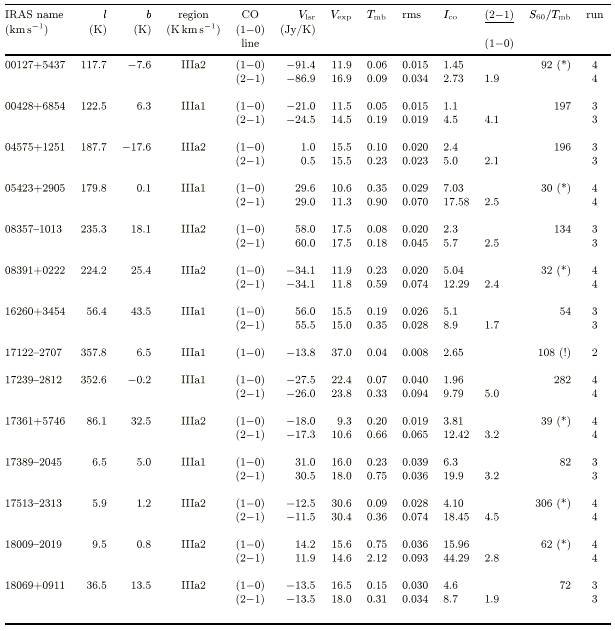
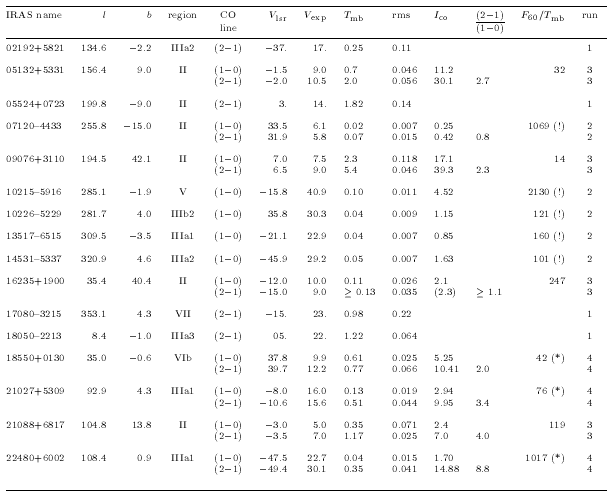
Table 13: CO detections for sources of the main sample (northern sources in regions IIIa1 and IIIa2).
Only the  ratio is corrected for the surface when the observations were made at SEST
(noted with a !). The measurements corrected for the effect of the offset reduced to avoid
interstellar contamination (see Sect. 2.3.1) are marked with a*
|
Table 13: continued
|
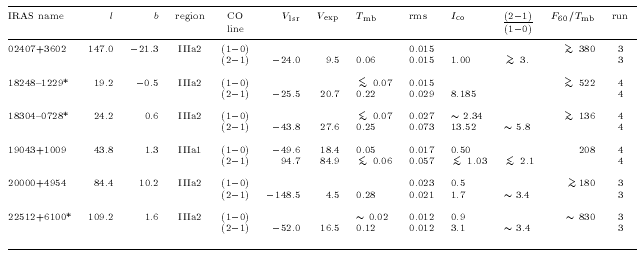
Table 14: Other CO detections. The notations are the same as in Table
13 (click here)
|
Table 15: CO tentative detections. Some of them were affected by interstellar
contamination and are noted with a*. In that cases, the rms was measured out of
the contaminated region of the spectrum
|
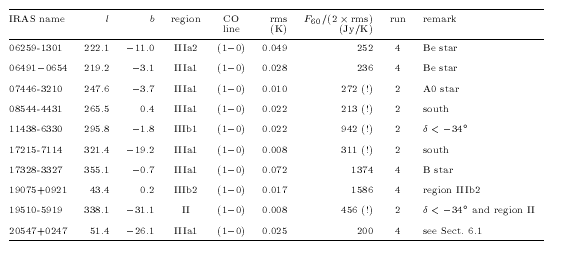
Table 17: Other CO non-detections. The reason why these
objects do not belong to the main sample is recalled in the last column

Figure 11: CO(1-0) and CO(2-1) spectra of the objects detected during the
3rd run (IRAM 30 m)


Figure 12: CO(1-0) and CO(2-1) spectra of the objects detected during the
4th run (IRAM 30 m)


Up: Infrared giants vs.
Copyright by the European Southern Observatory (ESO)
![]() ratio. These tables are the basis of the
statistical analysis and are referenced in the text.
ratio. These tables are the basis of the
statistical analysis and are referenced in the text.
![]() ratio using a
a correction for the surface of the antenna; then, we present our own
observations, starting with the main sample studied here, and continuing with
miscellanous objects.
ratio using a
a correction for the surface of the antenna; then, we present our own
observations, starting with the main sample studied here, and continuing with
miscellanous objects.
