To check the validity of the numerical simulation, a comparison of its
outputs with the observed background solar velocity spectrum can be
performed. Fast Fourier Transforms have been applied to the two simulated
series and their power density spectrum calculated. The results are
presented in Fig. 5 (click here). No significative differences are seen
between the two spectra. Only at very low frequencies (below 1 ![]() Hz),
where the effects of the active regions are significative, some differencies
can be seen.
Hz),
where the effects of the active regions are significative, some differencies
can be seen.
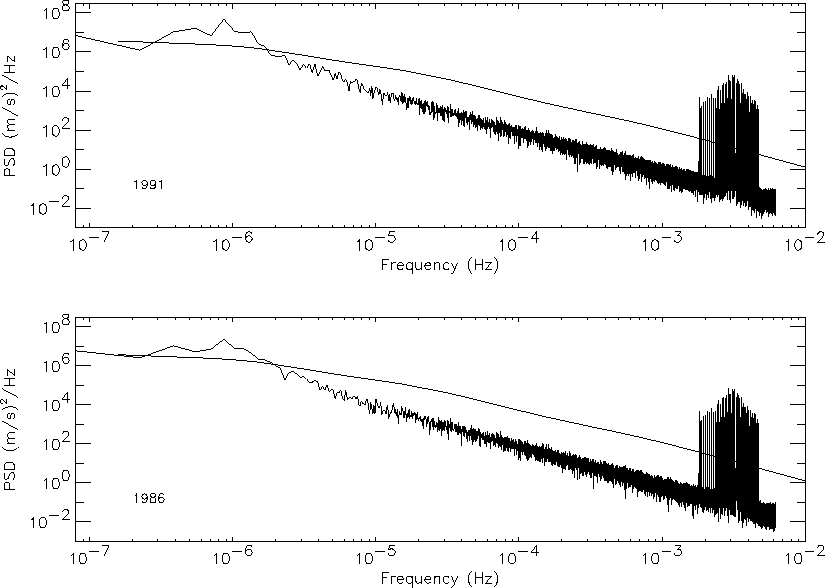
Figure 5: Power spectral density of the calculated GOLF velocity measurements for high
(1991 simulated series) and low (1986) solar activity. It is also shown the
best fit to the earth-based observed estimation (Pallé et al. 1995)
In both series we have superposed the curve corresponding to the best
fitting to the background solar velocity noise spectrum (B.S.V.N.S.) from
earth-based observations (Pallé et al. 1995). The power of the
simulated series is nearly an order of magnitude lower than the observed one
in the region above ![]() Hz. This difference can be explained mainly
due to the earth atmospheric noise, which has not been simulated, and the
presence of power due to the window function of the one station
observations. However, these effects will not contribute to the observations
made in space. Effectively, measurements made by the GOLF experiment in the
space (Gabriel et al. 1997) confirm our predictions at low
frequencies.
Hz. This difference can be explained mainly
due to the earth atmospheric noise, which has not been simulated, and the
presence of power due to the window function of the one station
observations. However, these effects will not contribute to the observations
made in space. Effectively, measurements made by the GOLF experiment in the
space (Gabriel et al. 1997) confirm our predictions at low
frequencies.