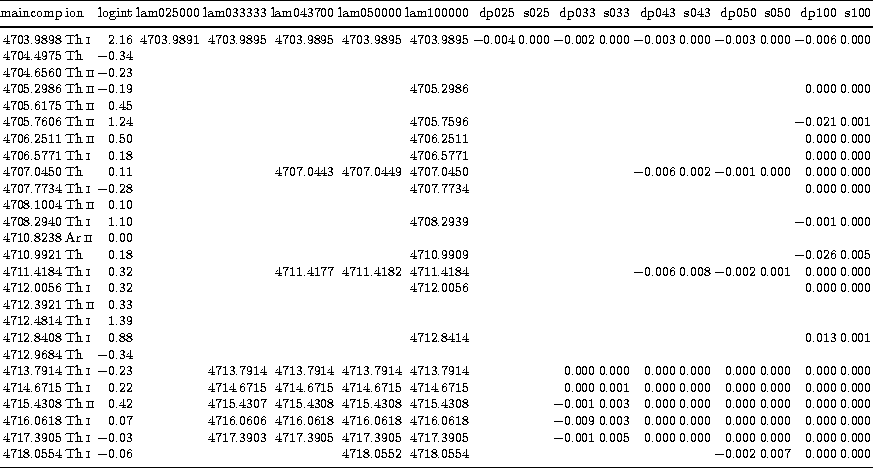
The improved Th and Ar input wavelengths for moderately high resolutions in astronomy are given in the electronic appendix of this paper, as ASCII tables. A sample page of the principal table is shown in Table 5 (click here). In addition to the original laboratory wavelength and the resolution-dependent improved blend wavelengths, it contains additional information giving the user freedom in the choice of his selection limits. However, no corrections are given for heavily blended lines, as such corrections are intrinsically uncertain. Restricted tables, listing only the resolution-dependent blend wavelength of preselected lines together with the laboratory wavelength and the emitting ion of the principal component, are also available; a sample page is given in Table 6 (click here). Lines that are in principle useful but intrinsically weak, and mixed Th-Ar blends giving results too dependent on the relative strength of the Ar versus Th components were removed from these ready-to-use lists.
Table 5: Sample page of the principal table for the
"standard" case of the Ar-to-Th line strength ratio
(see Table 1 (click here)), showing the laboratory wavelength [Å]
(Col. 1), the emitting ion (Col. 2) and the relative intensity in
log-scale (Col. 3) of the principal component; the resolution-dependent
blend wavelengths [Å] (Cols. 5-9), and their corresponding displacement
![]() [pix] and discretisation stability parameter s [pix]
(Cols. 10-20). The headers of Cols. 5-9 refer to
[pix] and discretisation stability parameter s [pix]
(Cols. 10-20). The headers of Cols. 5-9 refer to ![]() /pixel-scale
and the headers of Cols. 10-20 refer to
/pixel-scale
and the headers of Cols. 10-20 refer to ![]() /pixel-scale
/pixel-scale
|
| maincomp | ion | ||
| 4686.1946 | 4686.1946 | ThI | ||
| 4690.6235 | 4690.6219 | ThI | ||
| 4694.0914 | 4694.0914 | ThII | ||
| 4698.2248 | 4698.2248 | Th | ||
| 4703.9895 | 4703.9898 | ThI | ||
| 4726.8683 | 4726.8683 | ArII | ||
| 4732.0543 | 4732.0532 | ArII | ||
| 4735.9064 | 4735.9058 | ArII | ||
| 4739.6784 | 4739.6764 | ThI | ||
|
|
Considerations that might influence the user's selection choice are e.g.
The user can make a final check on the selection and line centering procedure for a particular lamp spectrum by inspecting the residuals between the measured line positions and the ones predicted by his calibration model (assuming the latter model is precise). The residuals for a given line on different frames should not correlate with discretisation (i.e., with the sub-pixel position of the line centre), and its average value over all frames should not deviate significantly from 0. A correlation with discretisation for completely unblended lines indicates that the line centering procedure contains (implicit) invalid assumptions about the PSF. This may also lead to an offset from 0 when not all discretisations are evenly sampled in the set of frames. Blended lines are expected to give rise to residuals that correlate with discretisation to the extent described by the parameter s in our tables. Significant offsets from 0 may hint to biased theoretical wavelengths. Such outliers, if any, should be rare (as argued in Sect. 3) after application of the proposed "cleaned" calibrator lists and thus easily recognizable.