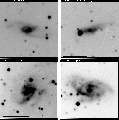
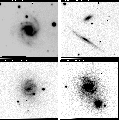
Figure 1: B images of the sample galaxies. North is at top and East to the left. The bar in the lower left indicates 1 arcmin. a) ESO 316G29, b) NGC3250E, c) ESO 317-G41, d) NGC 3318, e) NGC 3378, f) ESO 340-G21, g) AM 2054-433, h) IC 5325
Total magnitudes and color indices were calculated for 8 galaxies of the sample. These values are listed in Table 4 (click here) and are not corrected for galactic absorption. B magnitudes are found in good agreement with RC3.
| Galaxy | B | B-V | V-R | R-I |
| ESO 316-G029 | 14.45 | 0.80 | 0.91 | 0.64 |
| NGC 3250E | 13.18 | 0.75 | 0.46 | - |
| NGC 3318 | 12.79 | 0.72 | 0.54 | 0.33 |
| NGC 3378 | 13.50 | 0.74 | 0.63 | 0.83 |
| ESO 340-G021 | 13.78 | 1.05 | 0.63 | 0.32 |
| AM 2054-433 N | 14.43 | 0.77 | 0.95 | 0.33 |
| AM 2054-433 S | 14.34 | 0.88 | 1.00 | 0.27 |
| IC 5325 | 11.77 | 0.59 | 0.53 | 0.28 |
B images of the galaxies are presented throughout Figs. 1 (click here)a-h were North is at top and East to the left. The bar in the lower left indicates 1 arcmin. A suitable image contrast was chosen to show features in the inner and outer regions of the galaxies.


Figure 1: B images of the sample galaxies. North is at top
and East
to the left. The bar in the lower left indicates 1 arcmin.
a) ESO 316G29, b) NGC3250E, c) ESO 317-G41, d)
NGC 3318, e) NGC 3378, f)
ESO 340-G21,
g) AM 2054-433, h) IC 5325
Surface brightness radial profiles were obtained using the ISOPHOTE package within STSDAS (Jedrezejewski 1987). This routine allows to calculate the galaxy inclination through the major and minor axis ratio of the isophote fitting ellipses. B profiles were decomposed into their bulge and disk components using the method described by Shombert & Bothun (1987). We used for this purpose the NFIT routine implemented in the FITTING package within STSDAS. Prior to the fitting, smoothing over non-axisymmetric features were taken into account.
BVRI and decomposition profiles are shown in Figs. 2 (click here)a-h were
mag arcsec-2 versus radius, in arcsec are plotted.
Error bars are only displayed as a reference for the
B-profile. The resulting structure parameters for both the
disk and bulge decomposition, ![]() ,
, ![]() , B0
(corrected for the inclination of the disk), and
, B0
(corrected for the inclination of the disk), and ![]() ,
together with the B/D light ratio and b/a are listed in Table 5 (click here)
for those galaxies in which the decomposition technique
was possible.
,
together with the B/D light ratio and b/a are listed in Table 5 (click here)
for those galaxies in which the decomposition technique
was possible.
| Galaxy | | | Bo | | b/a | |
| ESO 316-G029 | 25.1 | 12.0 | 25.7 | 47.9 | 0.4 | 0.35 |
| NGC 3250E | - | - | 22.7 | 15.7 | 0.7 | - |
| NGC 3318 | 21.7 | 2.5 | 23.7 | 33.0 | 0.5 | 0.13 |
| NGC 3378 | - | - | 22.0 | 11.3 | 0.8 | - |
| ESO 340-G021 | 24.7 | 3.0 | 23.1 | 12.7 | 0.8 | 0.05 |
| AM 2054-433 N | 24.5 | 2.0 | 23.5 | 10.5 | 0.5 | 0.05 |
| AM 2054-433 S | 25.8 | 15.0 | 26.0 | 45.0 | 0.2 | 0.48 |
| IC 5325 | 21.9 | 1.5 | 22.6 | 32.3 | 0.7 | 0.02 |
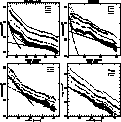
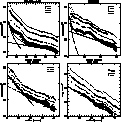
Figure 2: Luminosity profiles of the sample galaxies. Error
bars are only displayed for the B-profiles as a reference.
The solid line is the best fit to the data for the the sum
of
a bulge profile (short dashed) plus an exponential disk (long
dashed). a) ESO 316-G29, b) NGC 3250E, c) NGC 3318, e)
ESO 340-G21,
f) AM 2054-433N, g) AM 2054-433S, h) IC 5325
In order to study stellar populations and dust distribution
in the galaxies, we also constructed B-V, B-I and V-R color
maps. Images were first aligned using the algorithm
described by Marston (1988), normalised to the same
integration time and rebinned by a ![]() box to improve the
signal-to-noise ratio. These color maps are discussed in
Sect. 4 (click here).
box to improve the
signal-to-noise ratio. These color maps are discussed in
Sect. 4 (click here).
We also calculate (B-V) colors of various knots present in most galaxies of the sample. These magnitudes were calculated subtracting an appropriate background that takes into account the galaxy luminosity profile. These results are discussed throughout Sect. 4 (click here).
For each galaxy all the flux along the slit was combined to create a "whole-aperture'' or "integrated'' spectrum, and a small aperture of 2 kpc in linear size was also extracted to obtain the spectra of the nuclear region (we use throughout this paper H0 = 75 km s-1 Mpc-1). Whole-aperture spectra were mainly used to determine the star formation activity in the outer regions of the galaxies and to classify them according to the criteria given by Kennicutt (1992).
From the nuclear spectra we were able to obtain
"pure-emission'' spectra using a similar method described by
Bica
(1988). First, we measured the EW of the following
absorption features: ![]() 3393 Å, CN 4200 Å,
3393 Å, CN 4200 Å, ![]() 4301 Å and
4301 Å and ![]() 5175 Å. These measurements
allowed us to select an appropriated stellar absorption
spectrum (template) that reproduces the underlying stellar
population. The pure-emission spectrum for each galaxy was
then obtained by subtracting the template from the original
spectrum. These templates were selected from a database that
contains early type galaxy spectra (Donzelli & Pastoriza
1997). Prior to the subtraction both galaxy and template
spectra were normalised to the continuum at 5870 Å.
Reddening of the galaxies was initially calculated choosing
appropriate E(B-V) values in order to get a good matching
between the galaxy and template continua over the blue
region. However, in each case E(B-V) was recalculated using
the pure-emission spectra assuming an intrinsic
5175 Å. These measurements
allowed us to select an appropriated stellar absorption
spectrum (template) that reproduces the underlying stellar
population. The pure-emission spectrum for each galaxy was
then obtained by subtracting the template from the original
spectrum. These templates were selected from a database that
contains early type galaxy spectra (Donzelli & Pastoriza
1997). Prior to the subtraction both galaxy and template
spectra were normalised to the continuum at 5870 Å.
Reddening of the galaxies was initially calculated choosing
appropriate E(B-V) values in order to get a good matching
between the galaxy and template continua over the blue
region. However, in each case E(B-V) was recalculated using
the pure-emission spectra assuming an intrinsic
![]() /H
/H![]() ratio of 2.85 (decrement for case B
Balmer recombination in an optically thin plasma at T =
104 K, Osterbrock 1989). For 6 galaxies of the
sample: ESO 316-29, NGC 3250E, ESO 317-41 and the
interacting pair AM 2054-433 it was possible to apply this
technique. For the remaining galaxies we could not find an
appropriate template from the database.
ratio of 2.85 (decrement for case B
Balmer recombination in an optically thin plasma at T =
104 K, Osterbrock 1989). For 6 galaxies of the
sample: ESO 316-29, NGC 3250E, ESO 317-41 and the
interacting pair AM 2054-433 it was possible to apply this
technique. For the remaining galaxies we could not find an
appropriate template from the database.
The measured equivalent width of the absorption features for both observed galaxies and templates are listed in Table 6 (click here).
| Galaxy | CaII-K | CN | CH-G | MgI+MgH |
| 3393 Å | 4200 Å | 4301 Å | 5175 Å | |
| EW(Å) | EW(Å) | EW(Å) | EW(Å) | |
| ESO 316-G029 | 10.1 | 10.2 | 7.7 | 6.6 |
| Template | 13.1 | 9.0 | 7.5 | 5.2 |
| NGC 3250E | 5.6 | 3.2 | 3.4 | 2.3 |
| Template | 4.5 | 2.4 | 2.2 | 3.2 |
| ESO 317-G041 | 13.7 | 7.5 | 6.5 | 3.5 |
| Template | 13.1 | 9.0 | 7.5 | 5.2 |
| ESO 266-G015 | 5.5 | 5.7 | 4.2 | 3.1 |
| Template | 5.5 | 5.5 | 4.9 | 3.7 |
| AM2054-433N | 8.8 | 4.8 | 6.4 | 5.6 |
| Template | 9.9 | 4.6 | 5.9 | 6.2 |
| AM2054-433S | 9.1 | 10.8 | 8.6 | 6.8 |
| Template | 10.3 | 9.5 | 8.0 | 7.9 |
In order to classify the spectra using the diagnostic
diagrams (Veilleux & Osterbrock 1987) we use line fluxes
measurements for [OII] 3727 Å, H![]() , [OIII] 4959,
5007 Å, [OI] 6300 Å, [NII] 6548, 6583 Å,
H
, [OIII] 4959,
5007 Å, [OI] 6300 Å, [NII] 6548, 6583 Å,
H![]() and [SII] 6717, 6731 Å, in the pure-emission
spectra. Fluxes are extinction corrected using the reddening
curve provided by
McCall et al. (1985). Table 7 (click here) lists the
observed EW(H
and [SII] 6717, 6731 Å, in the pure-emission
spectra. Fluxes are extinction corrected using the reddening
curve provided by
McCall et al. (1985). Table 7 (click here) lists the
observed EW(H![]() + [NII]) and EW([OII]) values for both
whole-aperture and nuclear spectra. Table 8 (click here) gives E(B-V)
observed values together with the line flux ratios
calculated from the pure emission spectra.
+ [NII]) and EW([OII]) values for both
whole-aperture and nuclear spectra. Table 8 (click here) gives E(B-V)
observed values together with the line flux ratios
calculated from the pure emission spectra.
Radial velocities were also measured from the nuclear spectra using the cross-correlation technique developed by Tonry & Davies (1979) as implemented in the RV program in the IRAF package. Typical rms values obtained were around 60 km s-1. The calculated radial velocities are also listed in Table 7 (click here).
| Galaxy | [OII] | H |
[OII] | H | cz |
| EW(Å) | EW(Å) | EW(Å) | EW(Å) | (km s- 1) | |
| ESO 316-G029 | 19 | 18 | 19 | 22 | 5654 |
| NGC 3250E | 30 | 58 | 27 | 59 | 2737 |
| ESO 317-G041 | 17 | 47 | 21 | 58 | 5708 |
| NGC 3318 | 6 | 24 | 6 | 26 | 2706 |
| NGC 3378 | 3 | 8 | - | 4 | 4858 |
| ESO 266-G015 | 14 | 59 | 17 | 63 | 3122 |
| ESO 340-G021 | - | 18 | 3 | 15 | 2683 |
| AM 2054-433 N | 12 | 29 | 19 | 37 | 9706 |
| AM 2054-433 S | 8 | 21 | 40 | 39 | 9297 |
| IC 5325 | 2 | 20 | - | 17 | 1581 |
We also determine the rotation curve of the galaxies that
show extended emission. For this purpose we use H![]() and [NII] 6583 Å emission lines and the cross-correlation
technique. Rotation curves are shown in Figs. 3 (click here)a-e,
where is plotted the velocity (in km s-1), corrected
for galaxy inclination, versus radius (in kpc) where
kinematical centers are adopted as origin of coordinates. A
comparison of our results for the spiral galaxy AM 2054-433
with those published by Persic & Salucci 1995 are found in
a very good agreement.
and [NII] 6583 Å emission lines and the cross-correlation
technique. Rotation curves are shown in Figs. 3 (click here)a-e,
where is plotted the velocity (in km s-1), corrected
for galaxy inclination, versus radius (in kpc) where
kinematical centers are adopted as origin of coordinates. A
comparison of our results for the spiral galaxy AM 2054-433
with those published by Persic & Salucci 1995 are found in
a very good agreement.
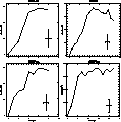

Figure 3: Rotation curve of the sample galaxies corrected for
the
galaxy inclination. Kinematical centers were used as origing
of
coordinates. The cross indicates the velocity and radius
uncertainties.
a) ESO 316-G29, b) ESO 317-G41, c) NGC 3318,
d) AM 2054-433N,
e) AM 2054-433S
Upper and lower panels of Figs. 4 (click here)a-j plot the whole-aperture and the nuclear spectra respectively. Wavelength is in angstroms and flux in units of 10-15 ergs cm-2 s-1 Å-1 and it is also indicated in the whole-aperture spectra the linear size, in kpc, of the integrated region. All spectra are corrected by redshift and galactic absorption and plotted on a common wavelength scale of 3600- 7000 Å. We have not corrected the spectra for reddening within the galaxies themselves.

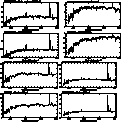
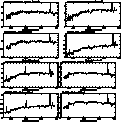
Figure 4: Whole-aperture (top panel) and nuclear (bottom
panel)
spectra of the sample galaxies. Flux is in units of
10-
15 ergs
cm-2 s-1 and wavelenght is in angstronms. a) ESO
316-G29,
b) NGC 3250E, c) ESO 317-G41, d) NGC 3318,
e) NGC 3378, f)
ESO 266-G15,
g) ESO 340-G21, h) AM 2054-433N, i) AM2054-433S,
j) IC 5325
We have also dated the star-formation events for the
peculiar galaxies comparing the equivalent width of the
Balmer lines with the values taken from a grid of
evolutionary synthesis models (Leitherer & Heckman 1995,
hereafter L&H). These models are based on a population of
massive stars (![]() ) and consider the
typical conditions found in HII regions, HII galaxies, blue
compact dwarf galaxies, nuclear starburst and infrared
luminous starburst galaxies. It was used as input parameter
the EW(H
) and consider the
typical conditions found in HII regions, HII galaxies, blue
compact dwarf galaxies, nuclear starburst and infrared
luminous starburst galaxies. It was used as input parameter
the EW(H![]() ) and we assumed an instantaneous burst
model with
) and we assumed an instantaneous burst
model with ![]() = 2.35,
= 2.35, ![]() and
and ![]() . We have adopted this model because the
[OIII]/H
. We have adopted this model because the
[OIII]/H![]() observed values are representative of HII
regions younger than 15 Myr according to the models of
Copetti et al. (1986). The results obtained are analyzed
throughout Sect. 4 (click here).
observed values are representative of HII
regions younger than 15 Myr according to the models of
Copetti et al. (1986). The results obtained are analyzed
throughout Sect. 4 (click here).