The relative magnitudes of the four lensed components of the Cloverleaf
determined with respect to the photometric reference star 40 are also
reported in Table 1. Furthermore, this table lists details of the
observations together with the
Modified Julian Day at the time of the observations, night averages of the
photometric determinations derived from applying the automatic image
decomposition technique (i.e. A1, B1, C1, D1 for the relative
photometric measurements of the A-D components, respectively, and
![]() ,
, ![]() ,
, ![]() ,
, ![]() , for the derived
measurement uncertainties as described below) and from applying the
interactive CLEAN algorithm
(i.e. A2, B2, C2, D2 and
, for the derived
measurement uncertainties as described below) and from applying the
interactive CLEAN algorithm
(i.e. A2, B2, C2, D2 and ![]() for a common value of the
measurement uncertainties). The same photometric measurements with their
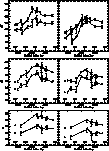
uncertainties are plotted in Fig. 2 (click here) (automatic image decomposition
technique, method 1) and in Fig. 3 (click here) (interactive CLEAN processing,
method 2), as a function of the Modified Julian Day.
for a common value of the
measurement uncertainties). The same photometric measurements with their
uncertainties are plotted in Fig. 2 (click here) (automatic image decomposition
technique, method 1) and in Fig. 3 (click here) (interactive CLEAN processing,
method 2), as a function of the Modified Julian Day.

Figure 2: Relative V, R and I magnitudes of the four lensed
components of H1413+117 with respect to the photometric reference star as a
function of the Modified Julian Day. These measurements are the results of
applying the automatic image decomposition technique (see text, method 1)

Figure 3: Relative V, R and I magnitudes of the four lensed
components of H1413+117 with respect to the photometric reference star as a
function of the Modified Julian Day. These measurements are the results of
applying the interactive CLEAN algorithm (see text, method 2)
We describe in this paragraph how the photometric error bar with
the automatic image decomposition technique has been derived for a
given science frame. A simulated frame which mimics the science frame
has been constructed. Gaussian profiles with comparable intensities,
relative image positions and FWHM were used to simulate the real objects.
Random values have been added to the simulation in a coherent way
with the noise characteristics of the real frames. The simulated frame has
then been reduced in exactly the same way as the real observations (including
PSF determination with the same stars). This (very time consuming) simulation
process has been repeated 10 times with different random noise values (still
in a coherent way with the noise in the real frame). The dispersions of the
derived values for each simulation of the set lead to realistic estimates
for the photometric error bars (i.e. ![]() ,
, ![]() ,
,
![]() ,
, ![]() ). Such estimates have also been compared with
the dispersion of measurements made on a series of 15 real observations,
taken during the same night in the Gunn i
filter (for which we assume intra-night photometric constancy): a
good agreement has been found. Despite the fact that the error estimates
for the automatic method are the
best ones available, we cannot rule out an underestimation of the error
(maximum by a factor 2) for some of the photometric data, especially those
with a seeing > 1.4.
). Such estimates have also been compared with
the dispersion of measurements made on a series of 15 real observations,
taken during the same night in the Gunn i
filter (for which we assume intra-night photometric constancy): a
good agreement has been found. Despite the fact that the error estimates
for the automatic method are the
best ones available, we cannot rule out an underestimation of the error
(maximum by a factor 2) for some of the photometric data, especially those
with a seeing > 1.4.
When using the interactive CLEAN algorithm, the error estimates are based on both the statistical uncertainties, as derived from the XECClean fitting, and the residuals in the CLEAN'ed image. The latter contribution includes the effects from seeing conditions and the quality of the PSF. Zero-point errors occurring when using a calibration star in the field, with colors different from the program object, can be as large as 0.02 magnitudes when changing from one detector to another.
Since our observations have been made using such a wide range of telescopes and CCD cameras, and since it has not been possible to maintain exactly the same set of filters throughout the monitoring period, some additional uncertainties are introduced in our data. However, all estimates show that these errors should be small compared to those due to the photometric decomposition of the four lensed QSO images.