As described in Sect. 2, each of the individual spectra consists of a
two dimensional array of ![]() pixels. For line identification
purposes, we have collapsed the two dimensional image array into a
vector of intensity versus wavelength. Due to the stigmatic
properties of SUMER, there is a one to one correspondence between the
brightness along a spectral line image and the image of
the solar atmosphere in the particular wavelength. Thus, the sections of the
spectral line emitted from the chromospheric network boundaries are much
brighter than those emitted from cell interiors. The position of the limb was
determined from the continuum intensity fall-off. We have integrated over 60
pixels just inside the limb. For these pixels the line-of-sight
is almost tangential to the solar surface and the effect of limb-brightening is
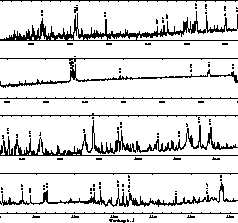
seen in many hot spectral lines. Figure 4 (click here) is a display of the
averaged composite spectrum presented in this paper. The count rates of this
average spectrum have been radiometrically calibrated and are given as
absolute intensities in column one of Table 1. These peak intensities are meant
as a first assessment of absolute line strengths. Absolute line intensities -
sorted by solar features and with blends separated - are deferred to a later
communication.
pixels. For line identification
purposes, we have collapsed the two dimensional image array into a
vector of intensity versus wavelength. Due to the stigmatic
properties of SUMER, there is a one to one correspondence between the
brightness along a spectral line image and the image of
the solar atmosphere in the particular wavelength. Thus, the sections of the
spectral line emitted from the chromospheric network boundaries are much
brighter than those emitted from cell interiors. The position of the limb was
determined from the continuum intensity fall-off. We have integrated over 60
pixels just inside the limb. For these pixels the line-of-sight
is almost tangential to the solar surface and the effect of limb-brightening is
seen in many hot spectral lines. Figure 4 (click here) is a display of the
averaged composite spectrum presented in this paper. The count rates of this
average spectrum have been radiometrically calibrated and are given as
absolute intensities in column one of Table 1. These peak intensities are meant
as a first assessment of absolute line strengths. Absolute line intensities -
sorted by solar features and with blends separated - are deferred to a later
communication.

Figure 4: Near-limb
quiet-Sun composite spectrum recorded on January 25, 1996
near the solar North pole. The most prominent lines are labelled.
Intensities are given in instrumental units

Figure 5: Uniformity of the dispersion along the spectral dimension of
detector B for three different wavelength positions. For pixels 150-800,
the scatter is less than 0.005 Å and thus the accuracy of
the wavelength determination is at least
0.02 Å
We have found that the dispersion of pixels 100-800 of detector B is linear to better than 0.02 Å. Figure 5 (click here) displays the dispersion of the spectrometer on detector B for three different wavelength positions. Notice that the uncertainties in determining the wavelengths are generally 0.02 Å or better. SUMER wavelength measurements were determined as follows: The positions of the centroids of all spectral features in the 100-800 pixel range were measured visually. Using several of the well-established wavelengths as standards we have calculated the wavelengths of all the lines in the image using a first order polynomial fit programme. The reference lines (preferably cold chromospheric lines) for the wavelength calibration are marked by an asterisk in Table 1. A comparison between measured and known wavelengths suggests that, on the average, the wavelengths for unblended lines were determined to about 0.02 Å. Column two of Table 1 lists the wavelengths available in the literature and column three lists the measured wavelengths. The vast majority of the laboratory wavelengths for column two, and identifications listed in column four and five are from Kelly (1987). Wavelengths of unidentified lines measured on the SUMER plots are also included in the table.