Most of the CO emission in this survey is contained in a band which extends trough all observed longitudes (Fig. 2 (click here)). The emission occurs preferentially above the plane for negative longitudes and below the plane for positive longitudes. This asymmetry, also observed in HI (Liszt & Burton 1980), results from a tilt in the gas distribution with respect to the galactic plane.
The CO emission is distributed closely along the galactic plane with the
highest intensity concentrated between ![]() and
and ![]() and within approximately 0.6
and within approximately 0.6![]() of the galactic plane. This central
source encompasses
the large molecular complexes coincident with the major continuum
sources Sgr A, B2, C and D, the rotating nuclear disk, and the expanding
molecular ring, which are more clearly demarcated in the longitude-velocity
diagrams (Bitran 1987). The strongly peaked central source appears very
asymmetrical in galactic longitude, with most of the emission found at
positive longitudes, resulting in an intensity-weighted mean longitude of
0.4
of the galactic plane. This central
source encompasses
the large molecular complexes coincident with the major continuum
sources Sgr A, B2, C and D, the rotating nuclear disk, and the expanding
molecular ring, which are more clearly demarcated in the longitude-velocity
diagrams (Bitran 1987). The strongly peaked central source appears very
asymmetrical in galactic longitude, with most of the emission found at
positive longitudes, resulting in an intensity-weighted mean longitude of
0.4![]() . The central source is also asymmetric in galactic latitude, with
most of the CO emission originating below the IAU galactic plane,
yielding an intensity-weighted mean latitude of
. The central source is also asymmetric in galactic latitude, with
most of the CO emission originating below the IAU galactic plane,
yielding an intensity-weighted mean latitude of ![]() .
.
The most intense CO emission outside the central source originates from two
features with emission peaks at ![]() ,
, ![]() (Clump 2)
and at
(Clump 2)
and at ![]() ,
, ![]() (Fig. 5 (click here)).
These sources are remarkable not
only for their high intensities, but also for their unusually large
velocity width.
(Fig. 5 (click here)).
These sources are remarkable not
only for their high intensities, but also for their unusually large
velocity width.
Owing to its sampling, sensitivity, and extended latitude coverage, the present survey reveals new CO features and shows the molecular counterparts of several classic HI features in the inner 4 kpc of the Galaxy. A complete analysis of these data, as well as a comparison with other isotopic species, will be made elsewhere.
Acknowledgements
We thank M. Koprucu for helping with some of the observations, and F. Avilés and J. Montani for the telescope maintenance. We are specially grateful to the referee, Dr. J. Bally, for his useful comments. The hospitality of Cerro Tololo Interamerican Observatory is highly appreciated. J.M., H.A. and L.B. acknowledge partial support from FONDECYT-Chile through grant 1950570.
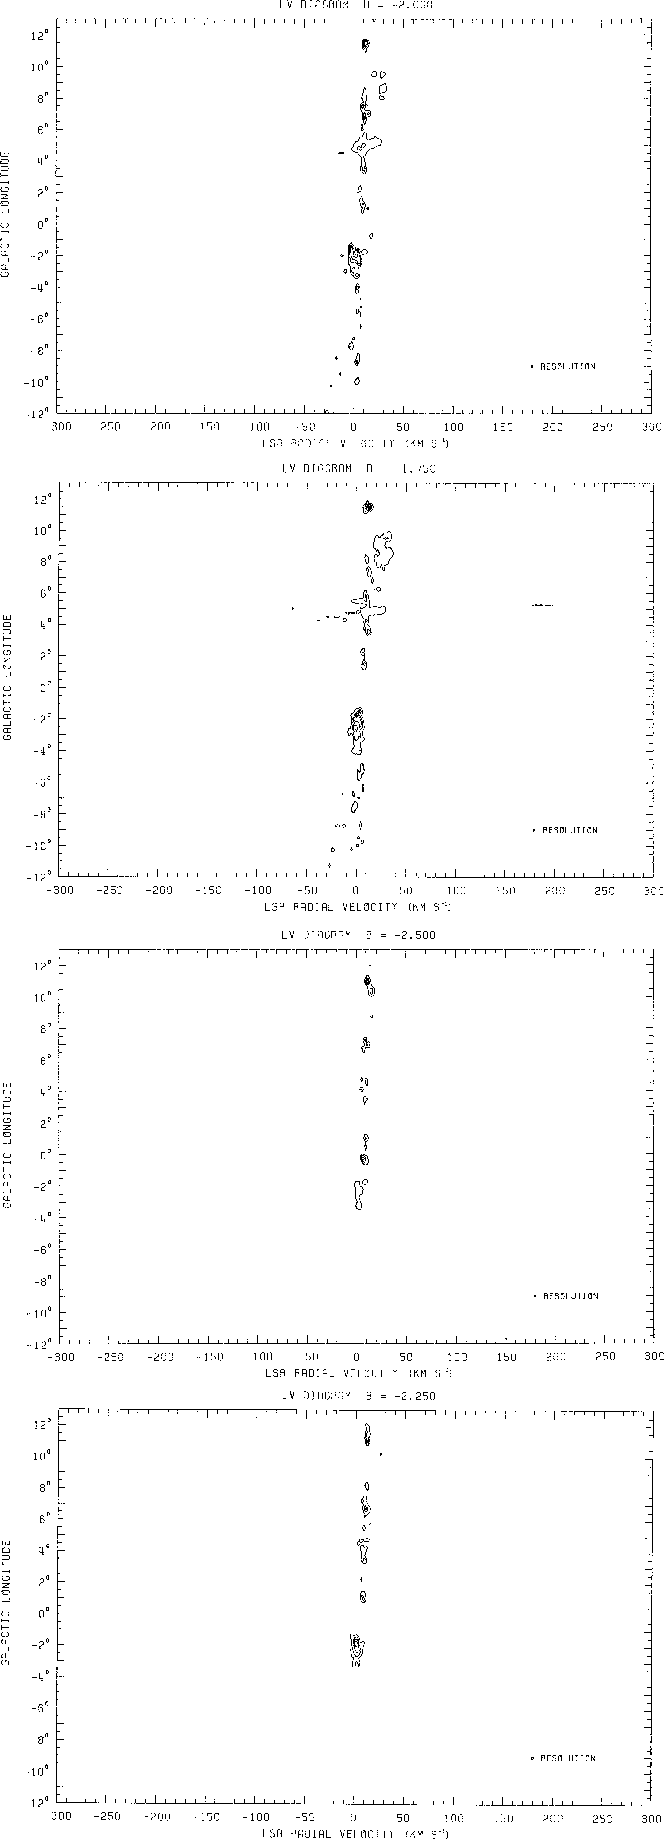
Figure 3: Complete sequence of longitude-velocity contour diagrams,
one for
each latitude observed. The contoured quantity is ![]() .
The contour interval is 1 K (
.
The contour interval is 1 K (![]() ), with the lowest contour
at 0.5 K (
), with the lowest contour
at 0.5 K (![]() ). Dotted contours indicate enclosed
depressions
). Dotted contours indicate enclosed
depressions
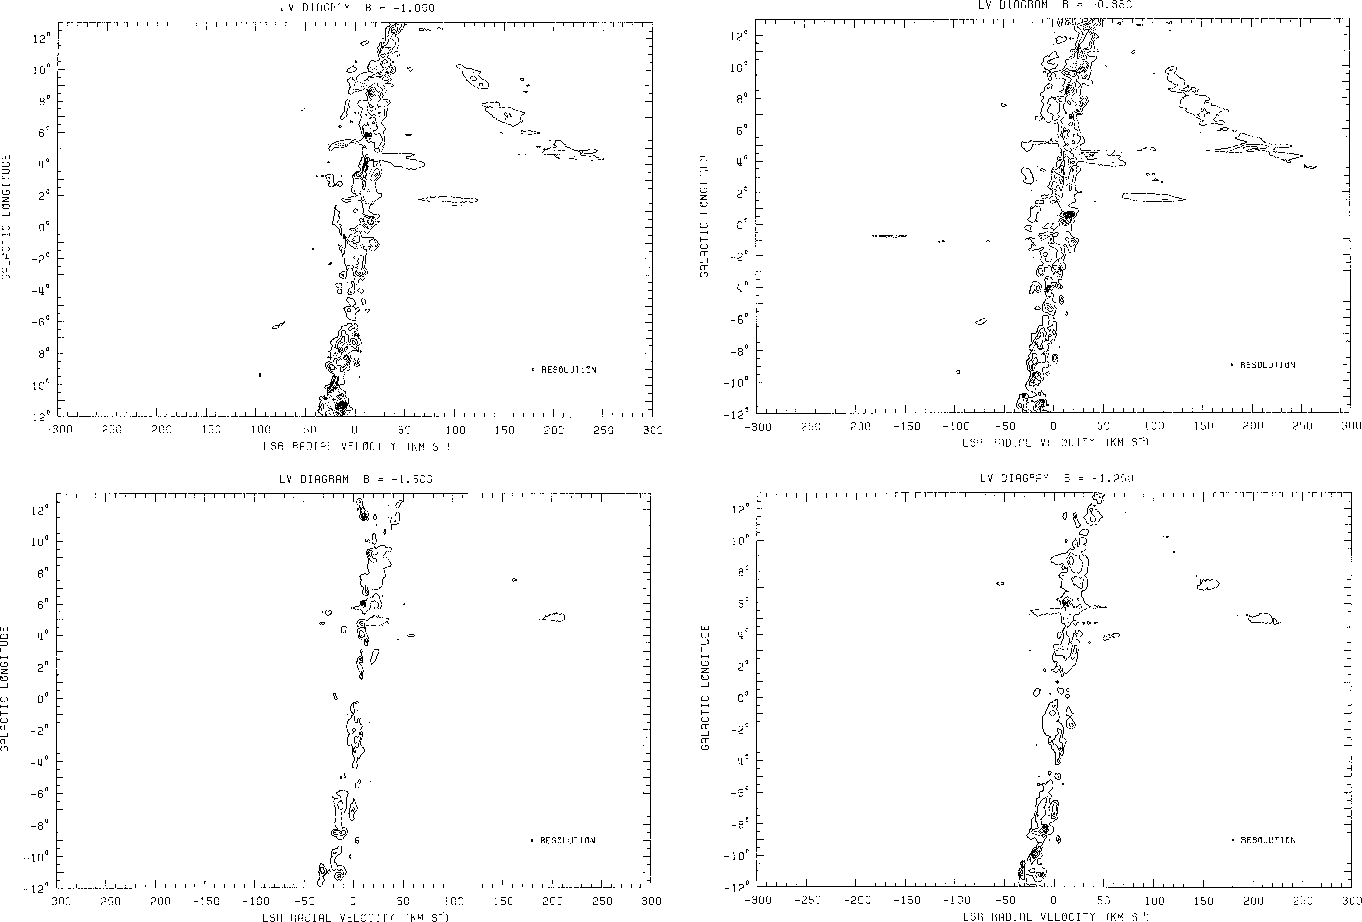
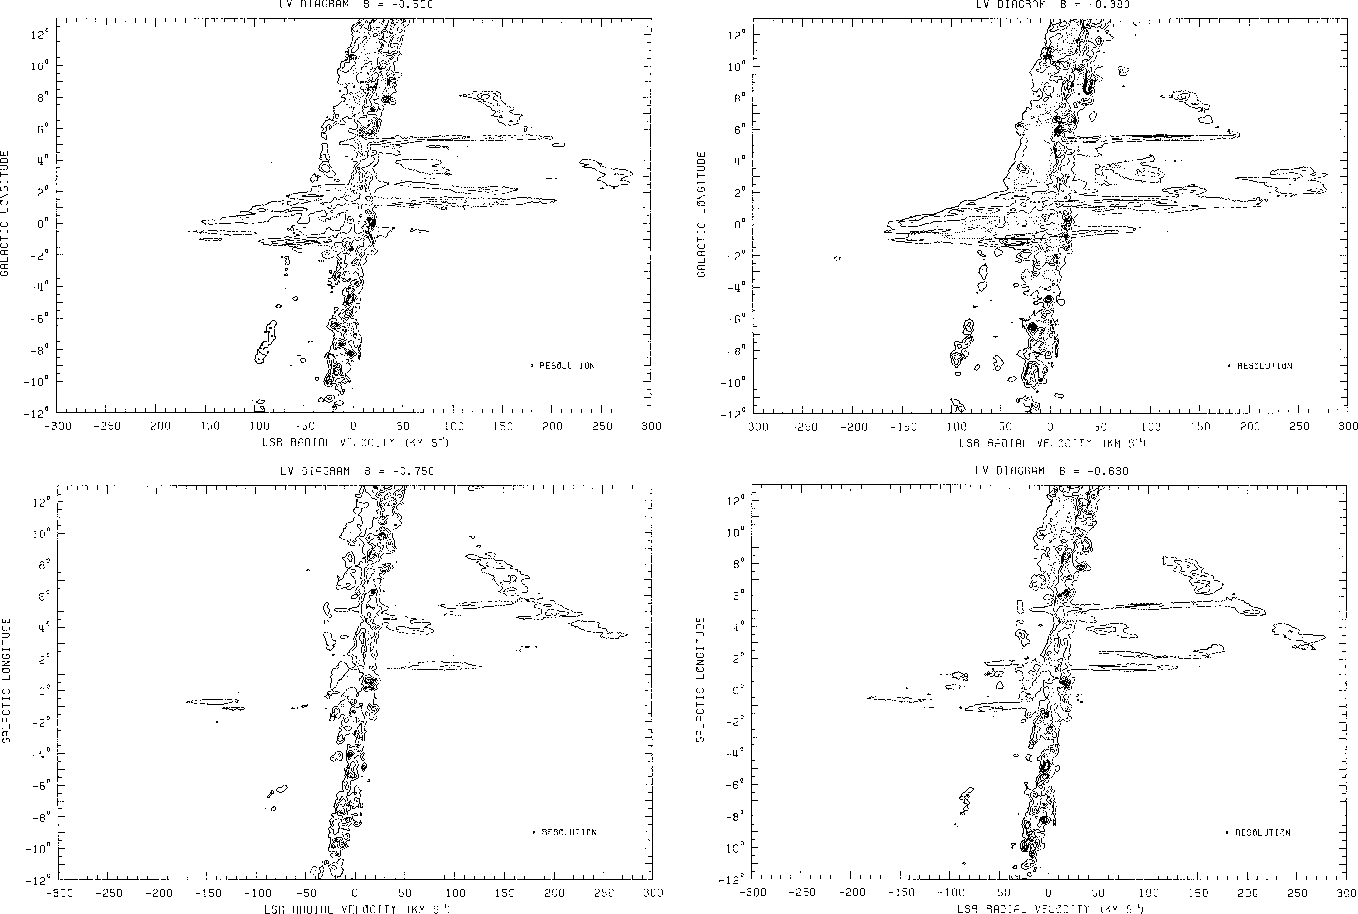
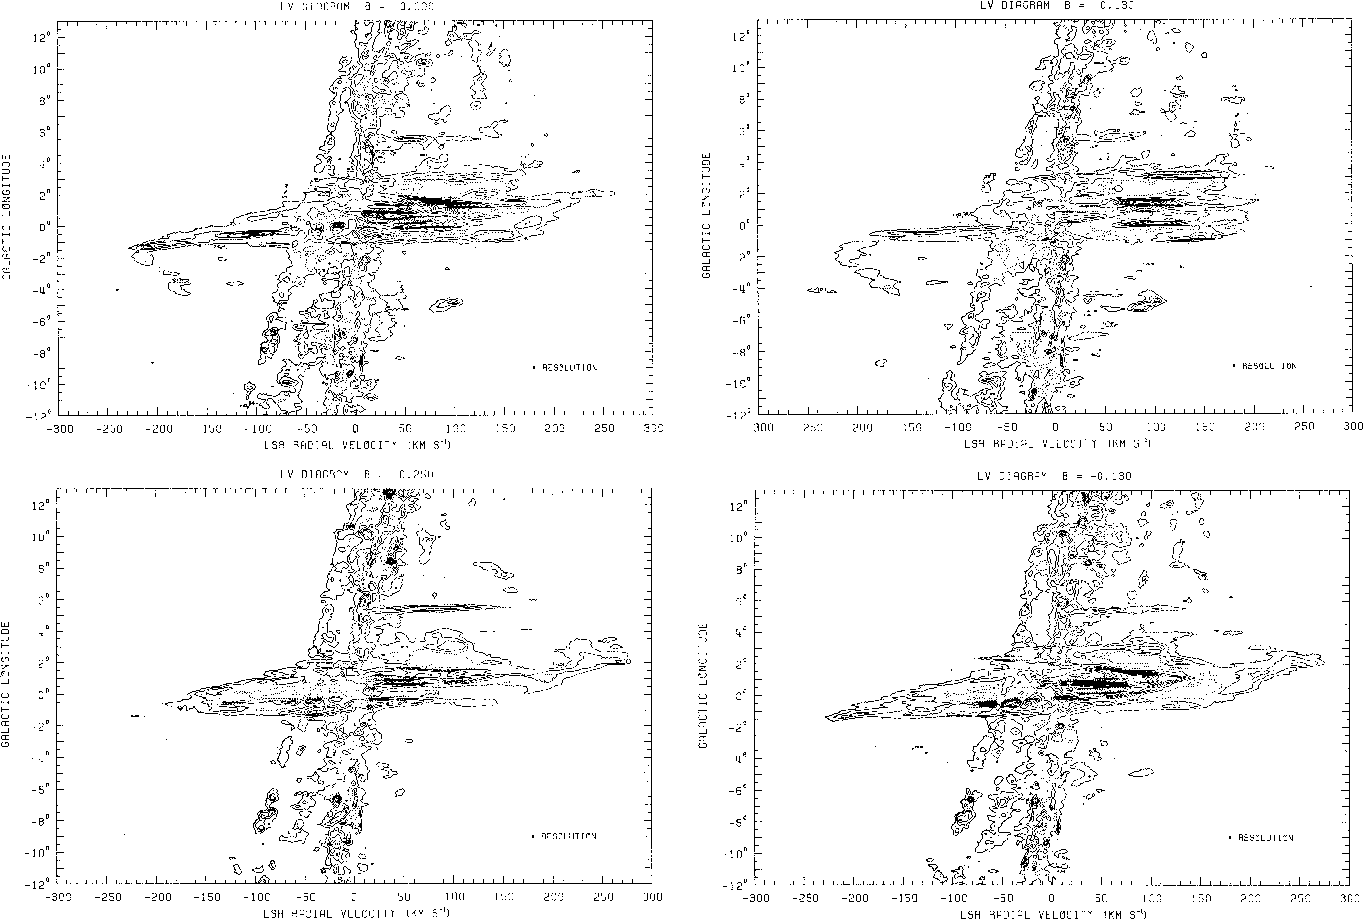
Figure: 3 continued
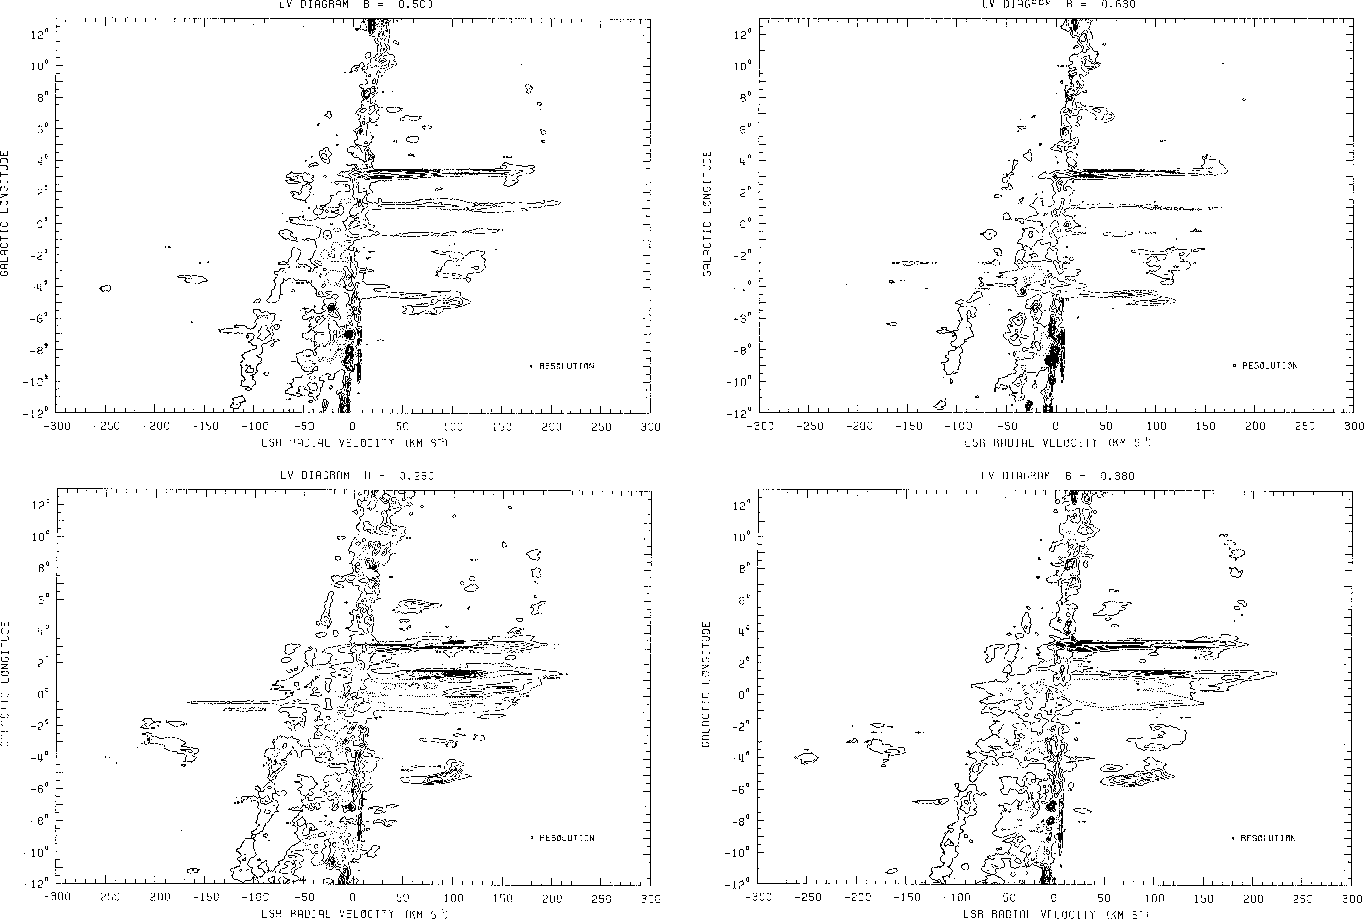
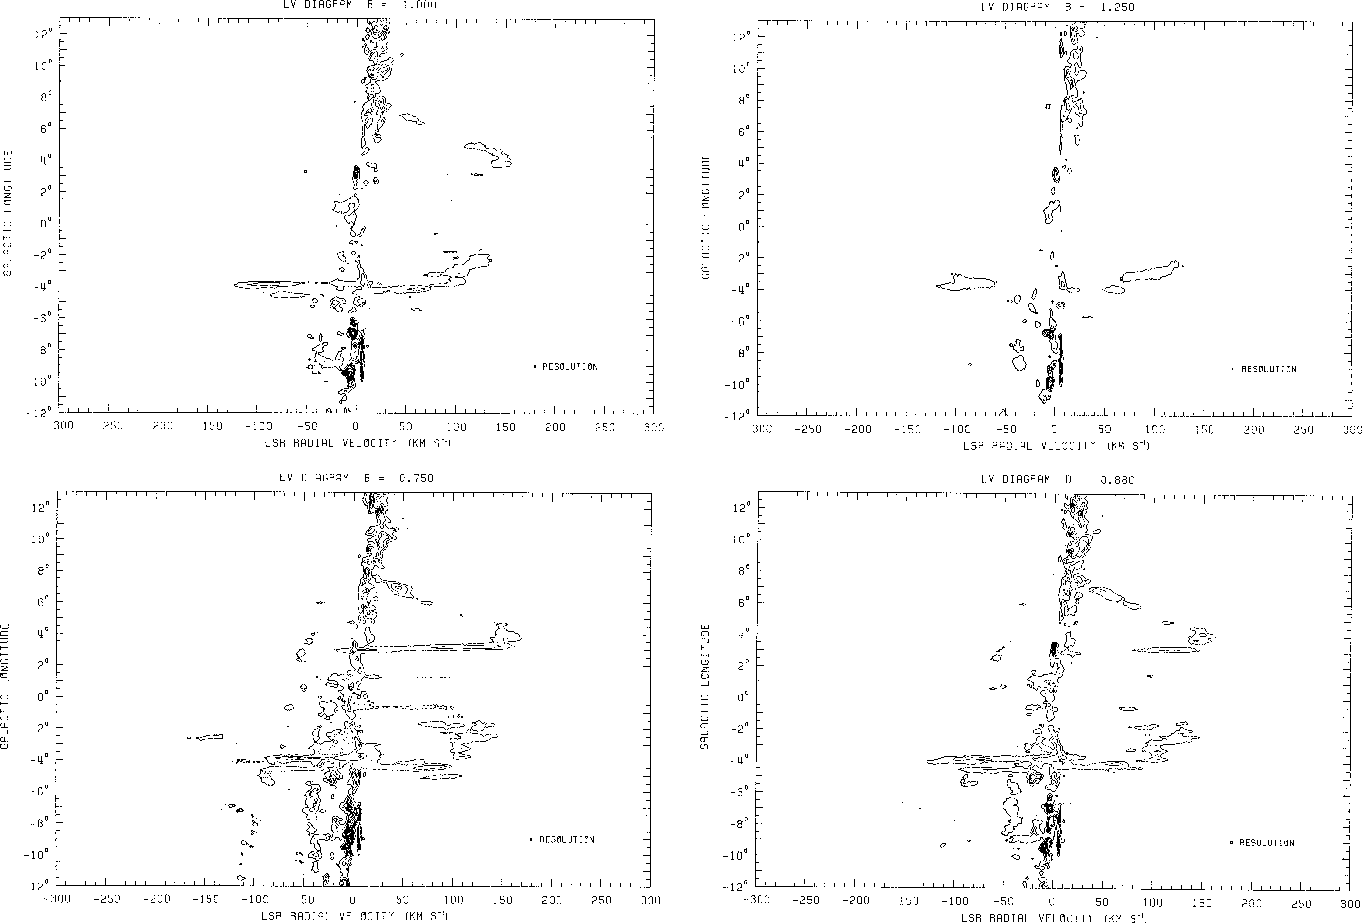
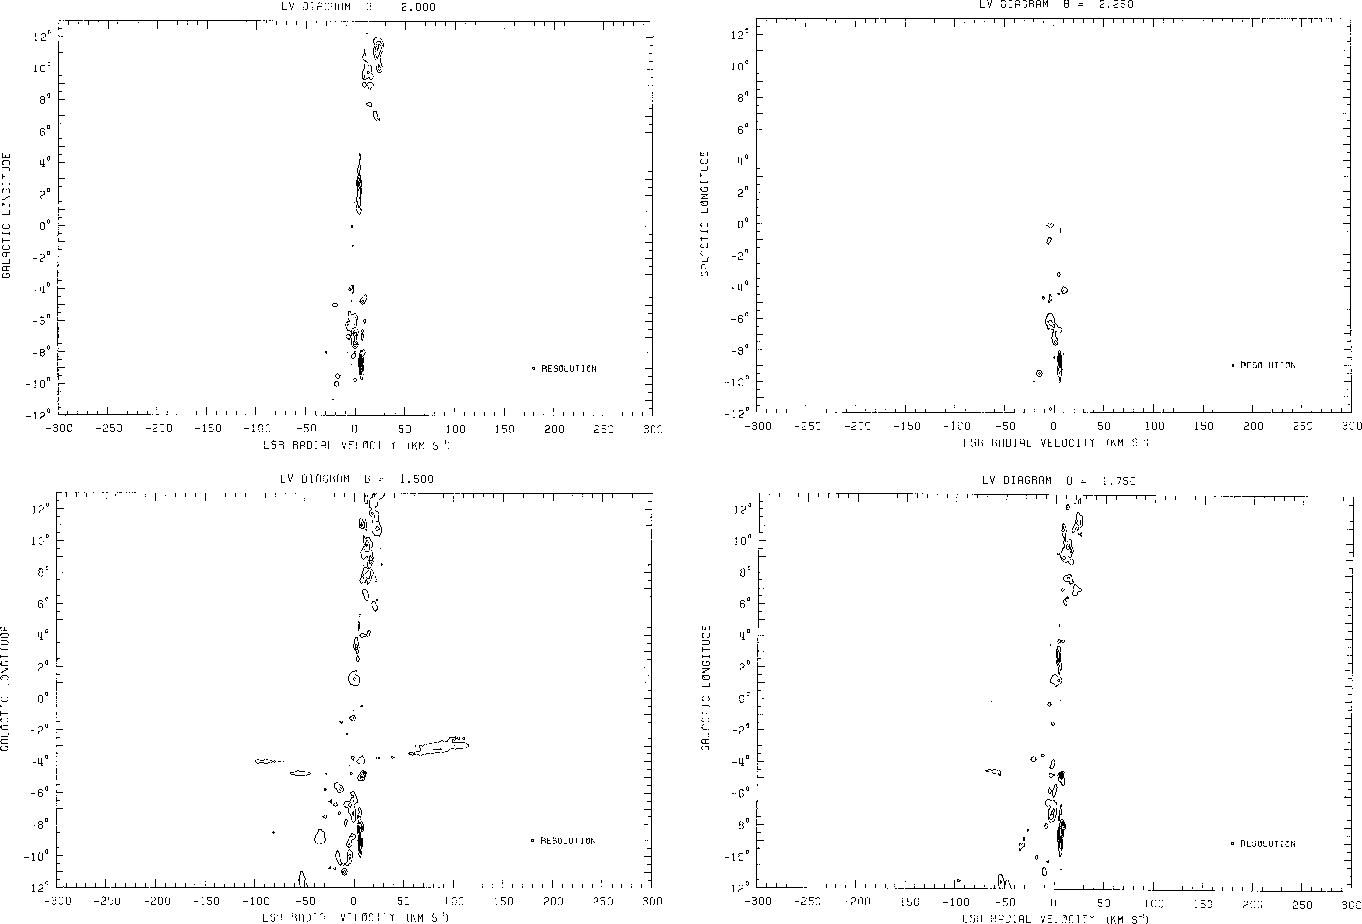
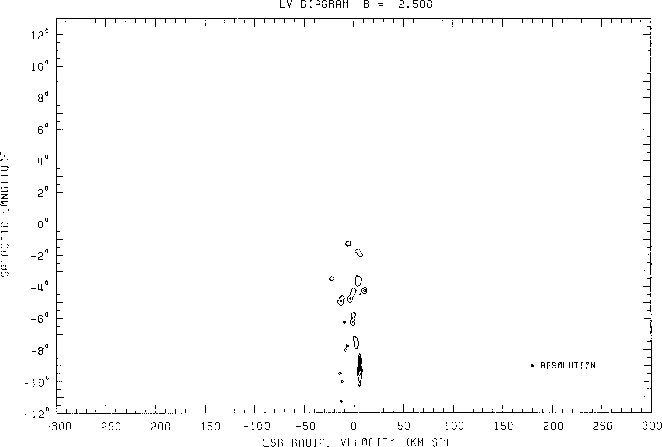
Figure: 3 continued
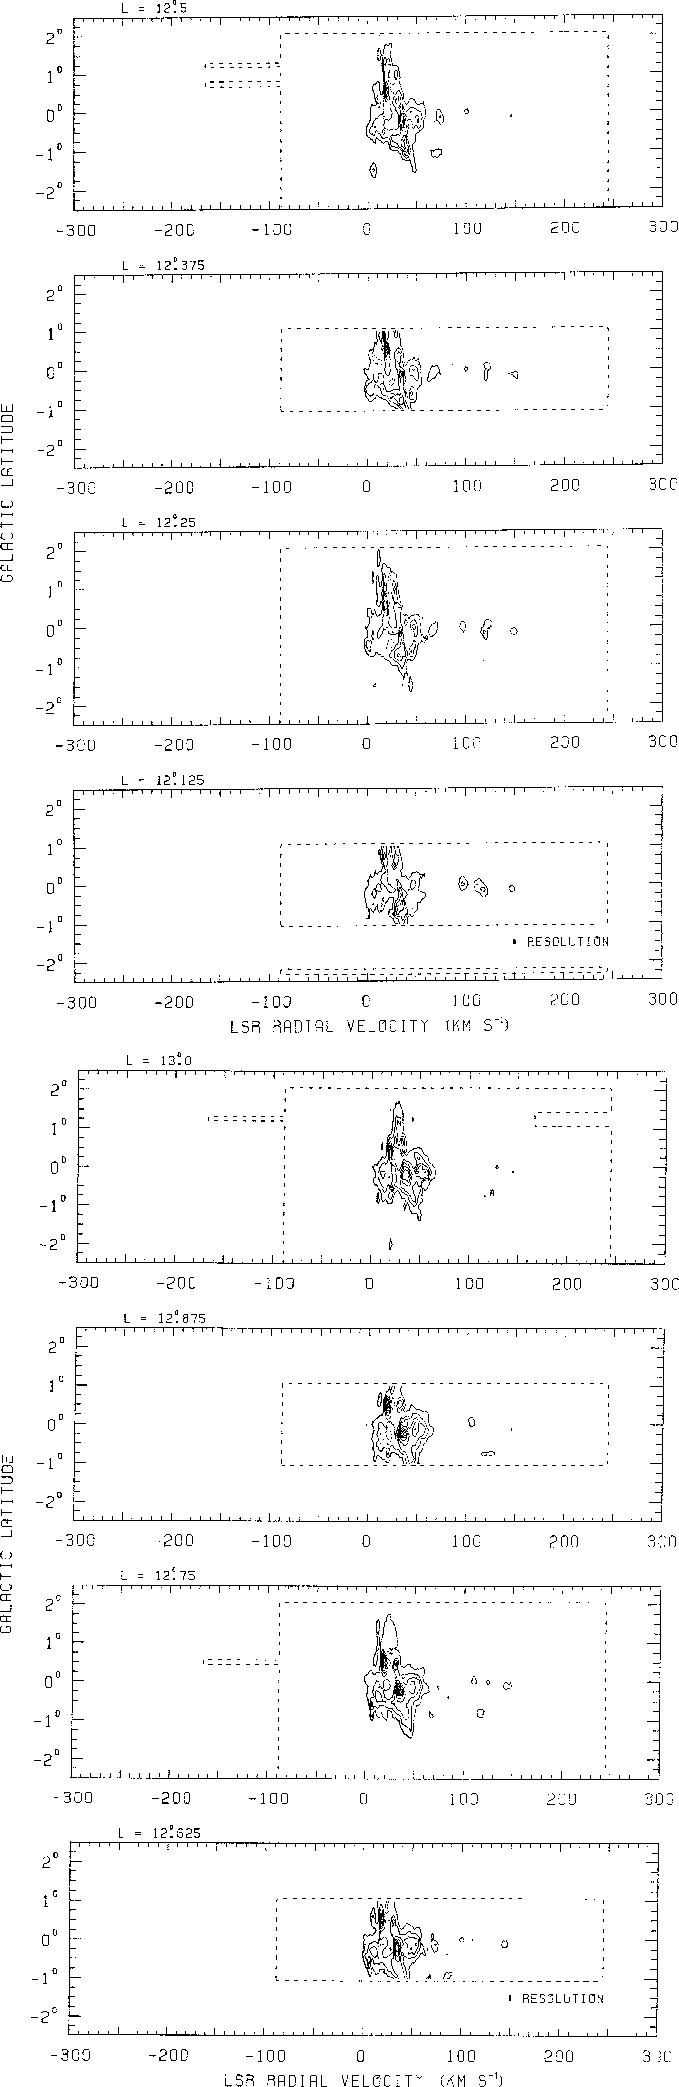
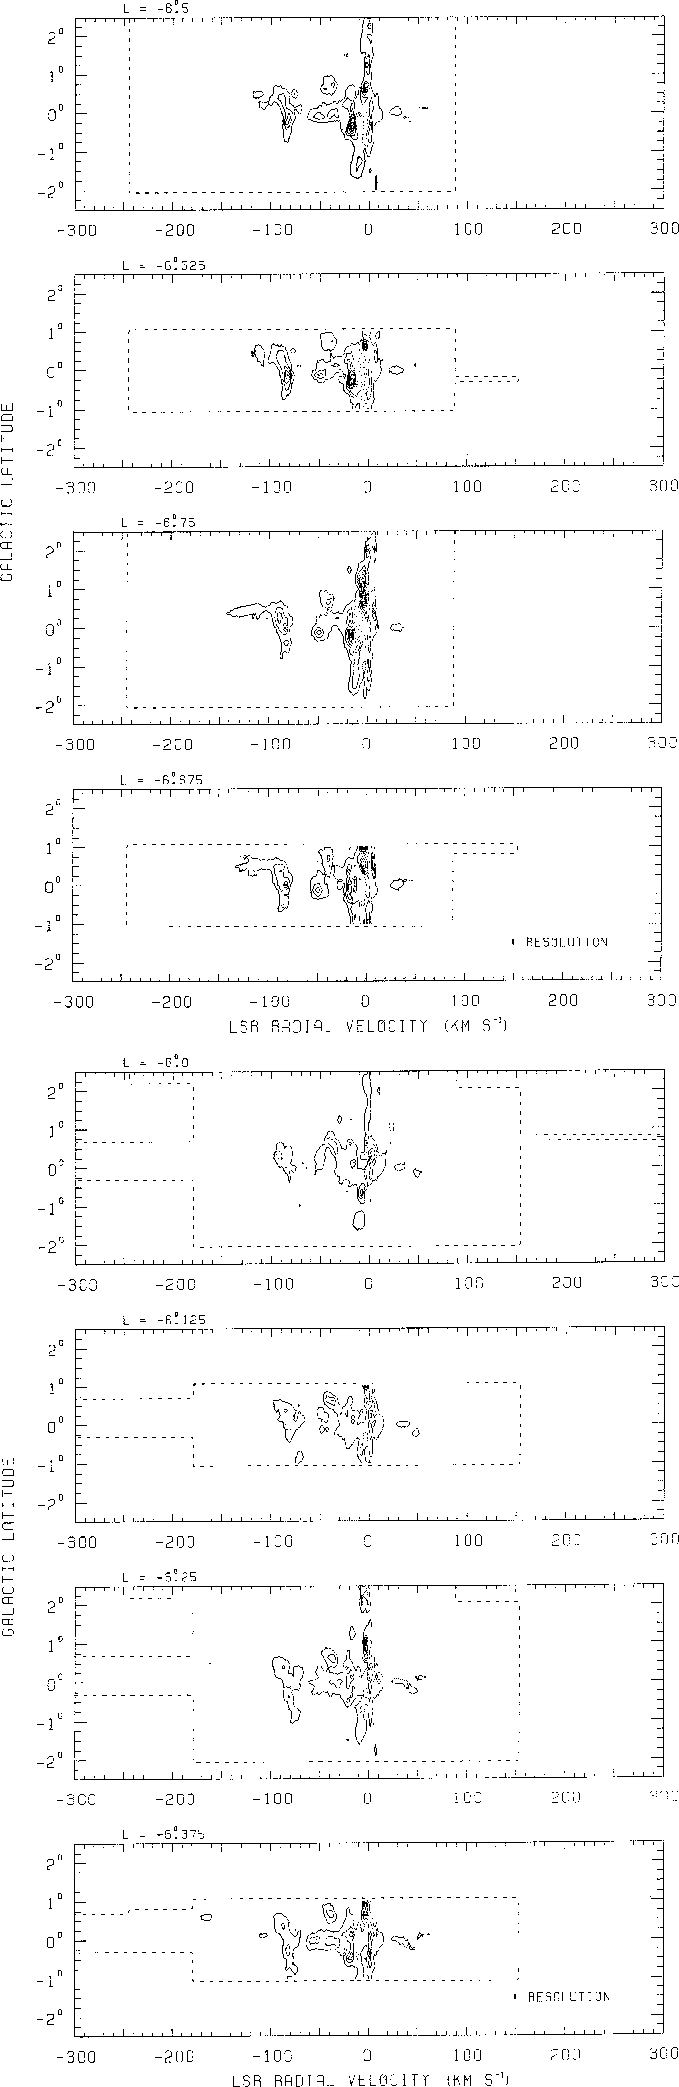
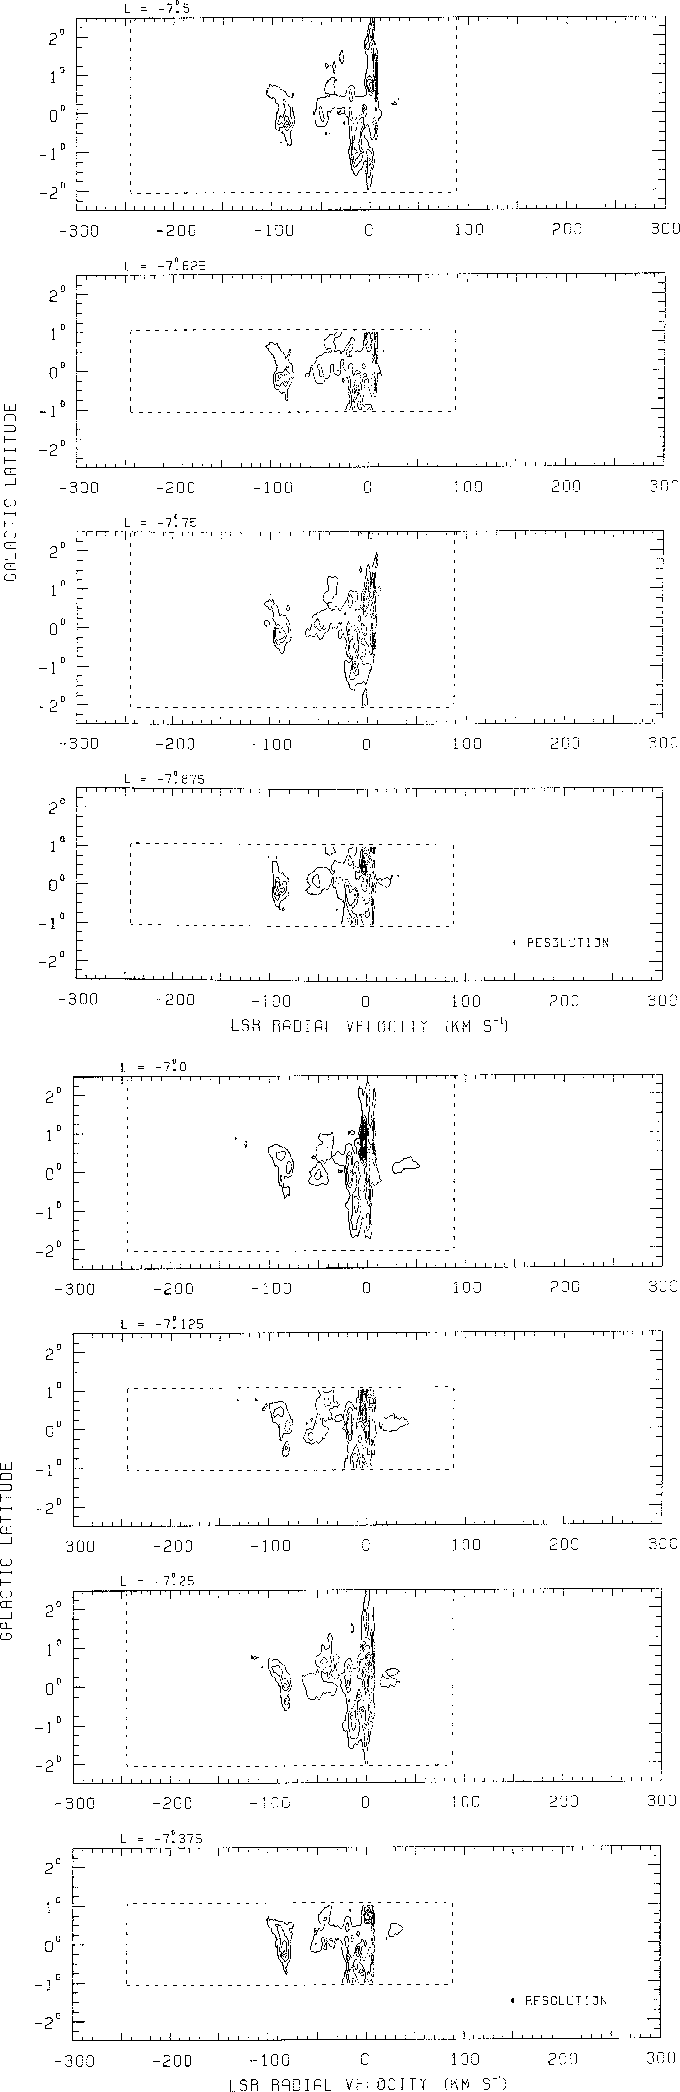
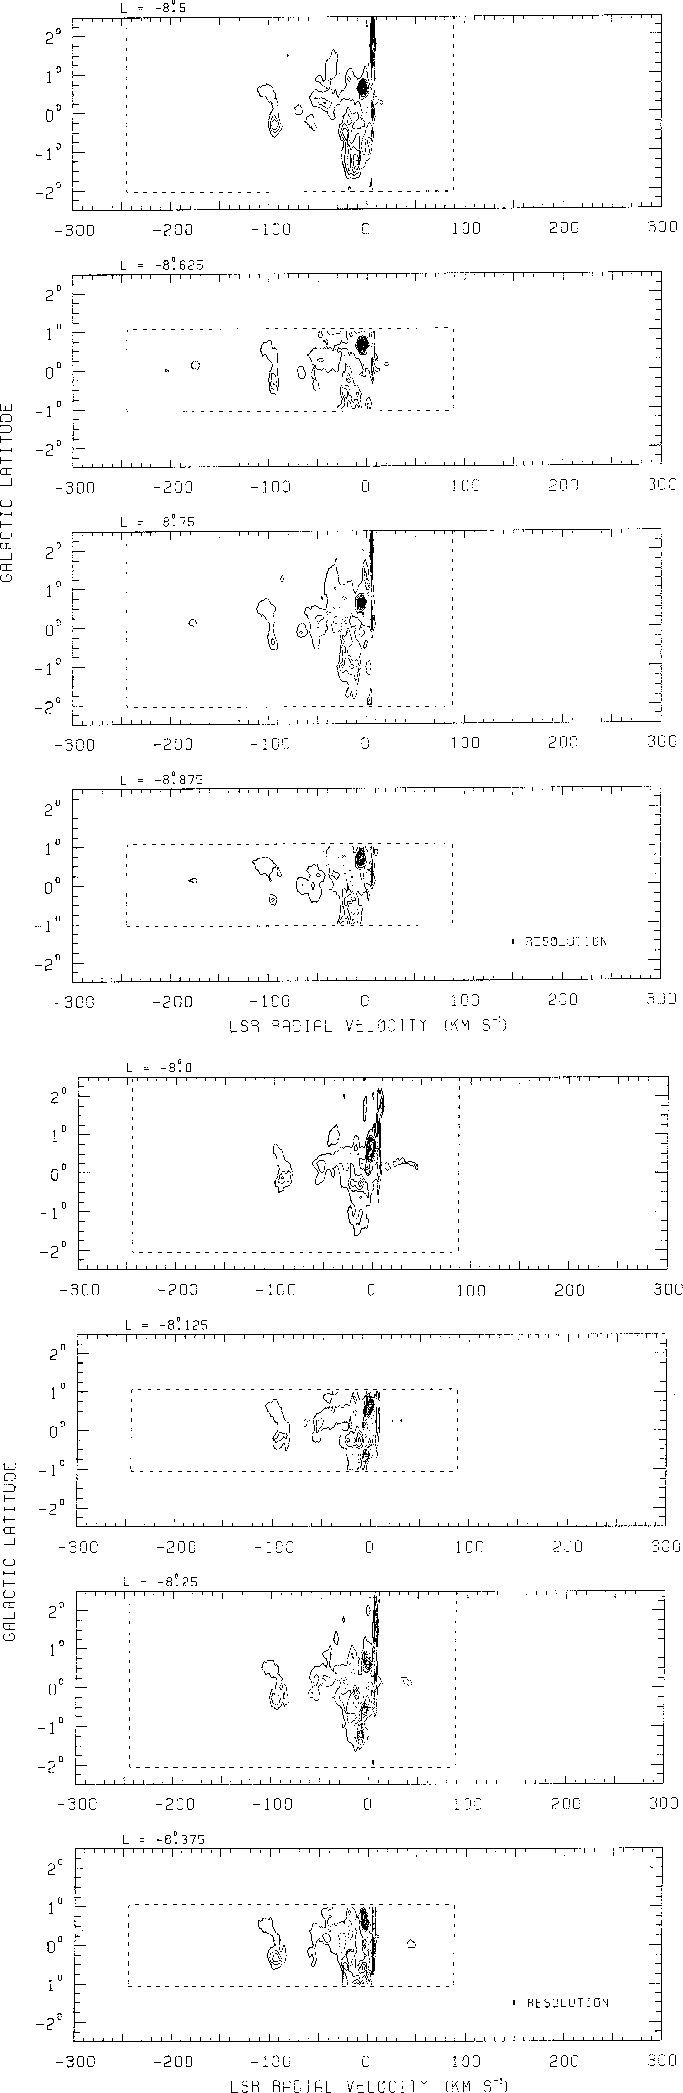
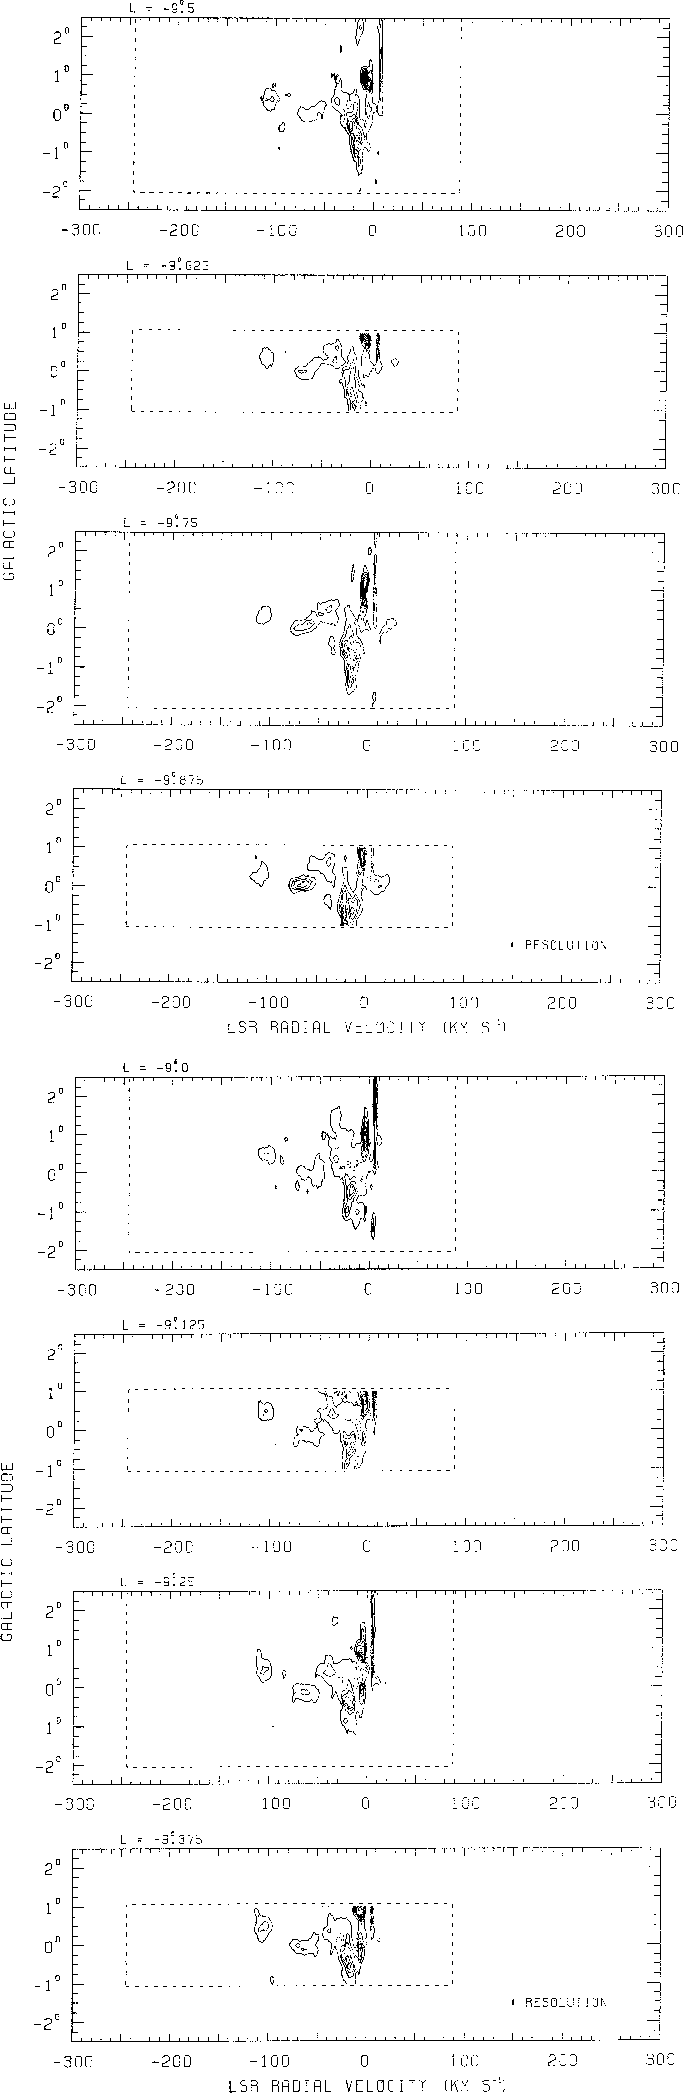
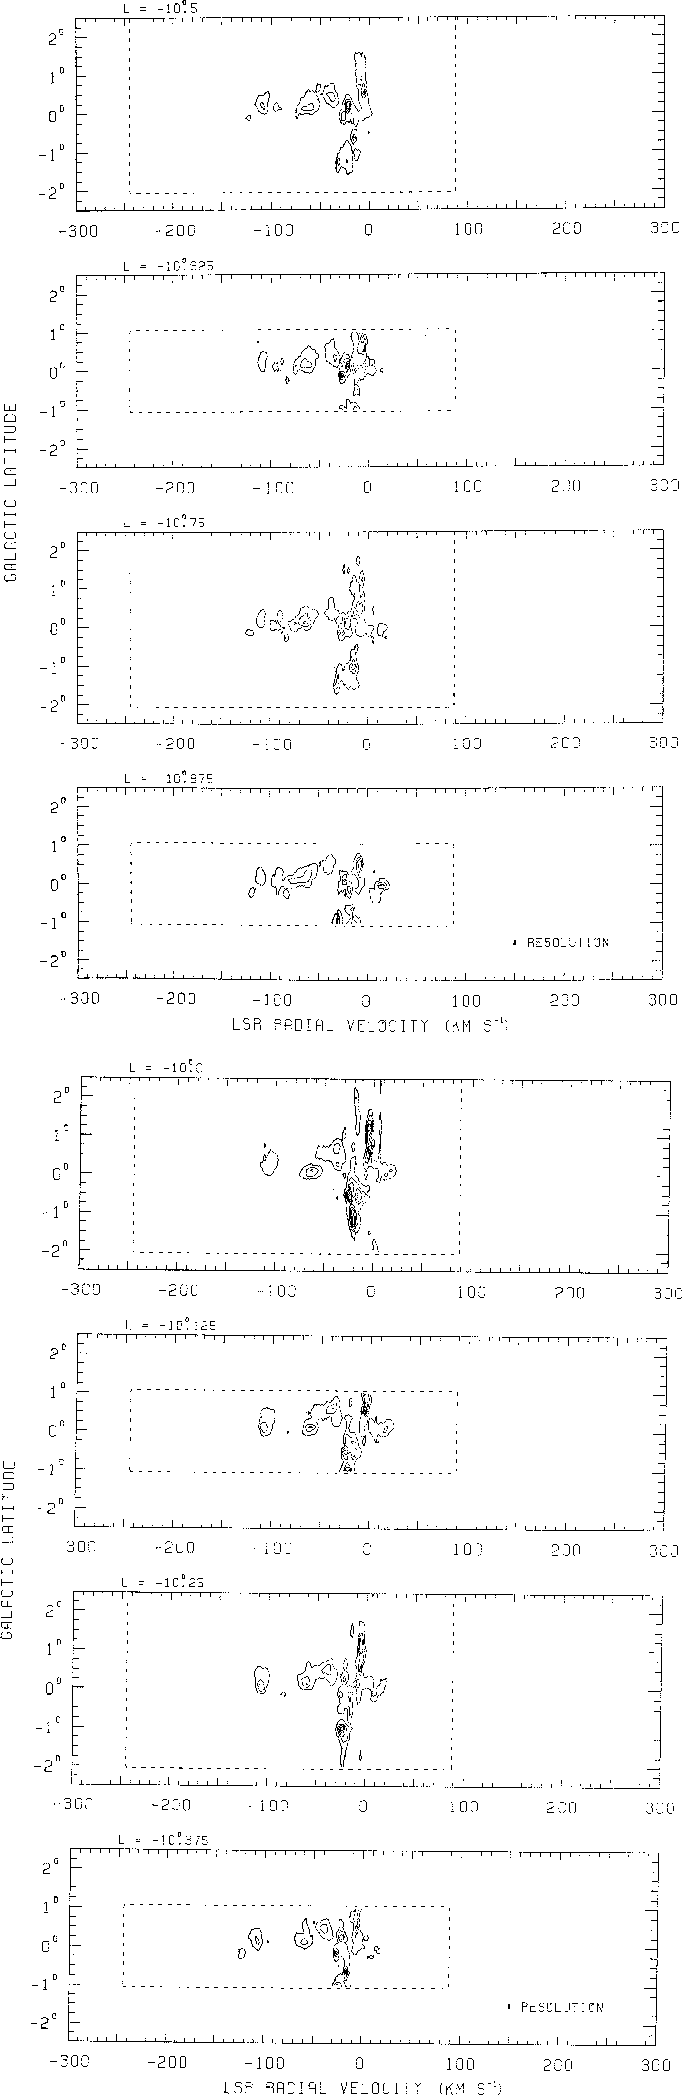
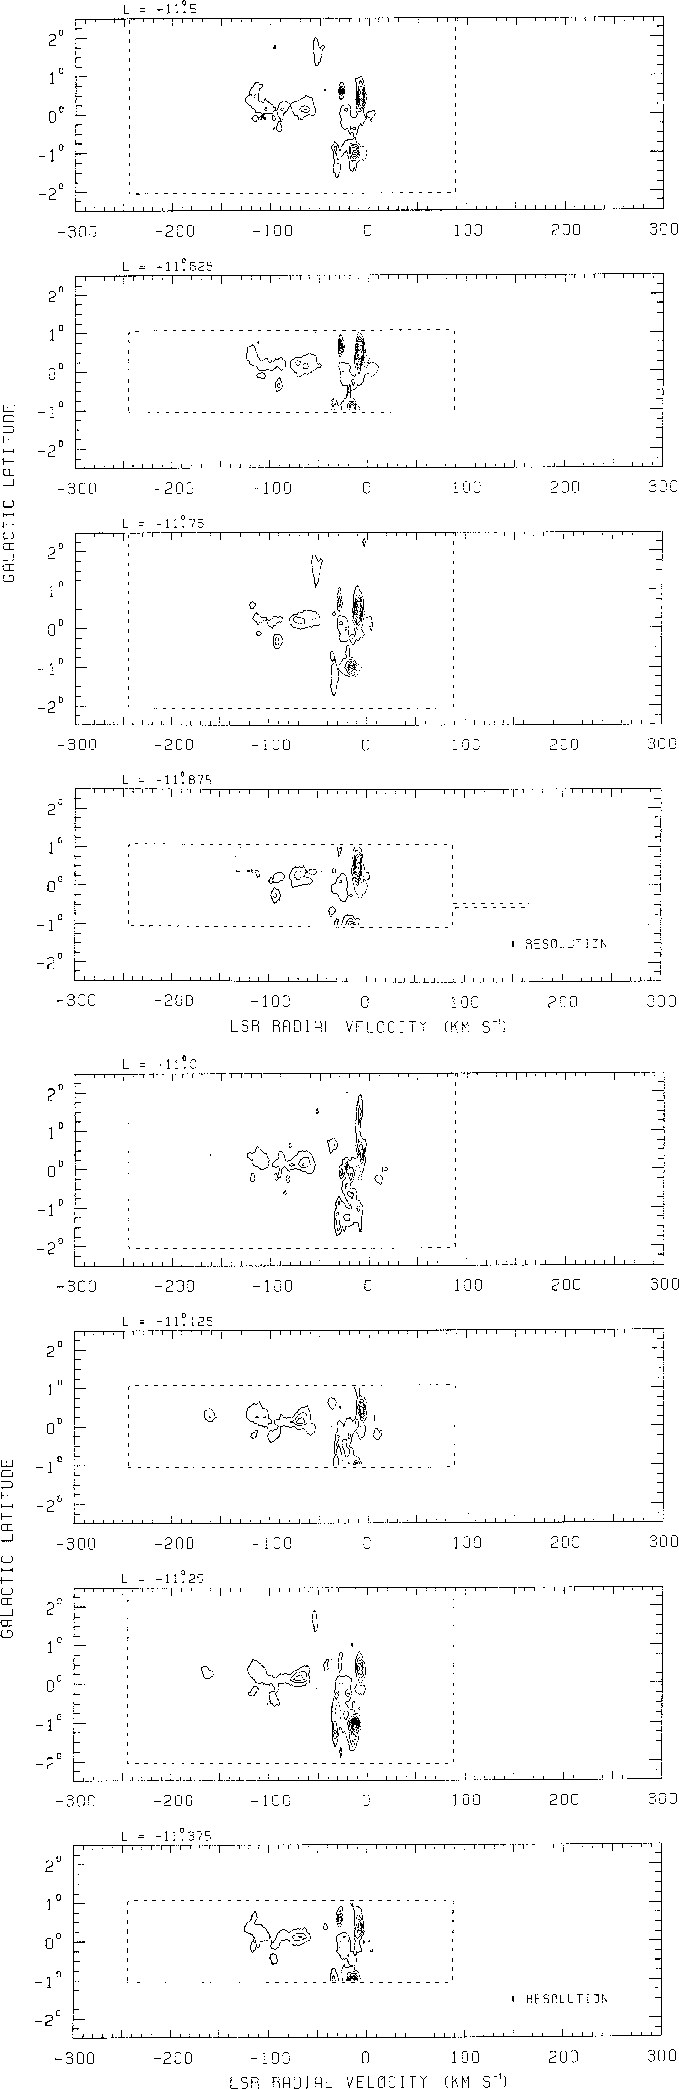
Figure 4: Complete series of latitude-velocity contour
diagrams, one for each longitude observed. The contoured quantity
is ![]() . The contour interval is 1 K (
. The contour interval is 1 K (![]() ), with
the lowest contour at 0.5 K (
), with
the lowest contour at 0.5 K (![]() ). Dotted contours indicate
enclosed depressions. The velocity and
latitude coverage of the survey are indicated by a broken line
). Dotted contours indicate
enclosed depressions. The velocity and
latitude coverage of the survey are indicated by a broken line
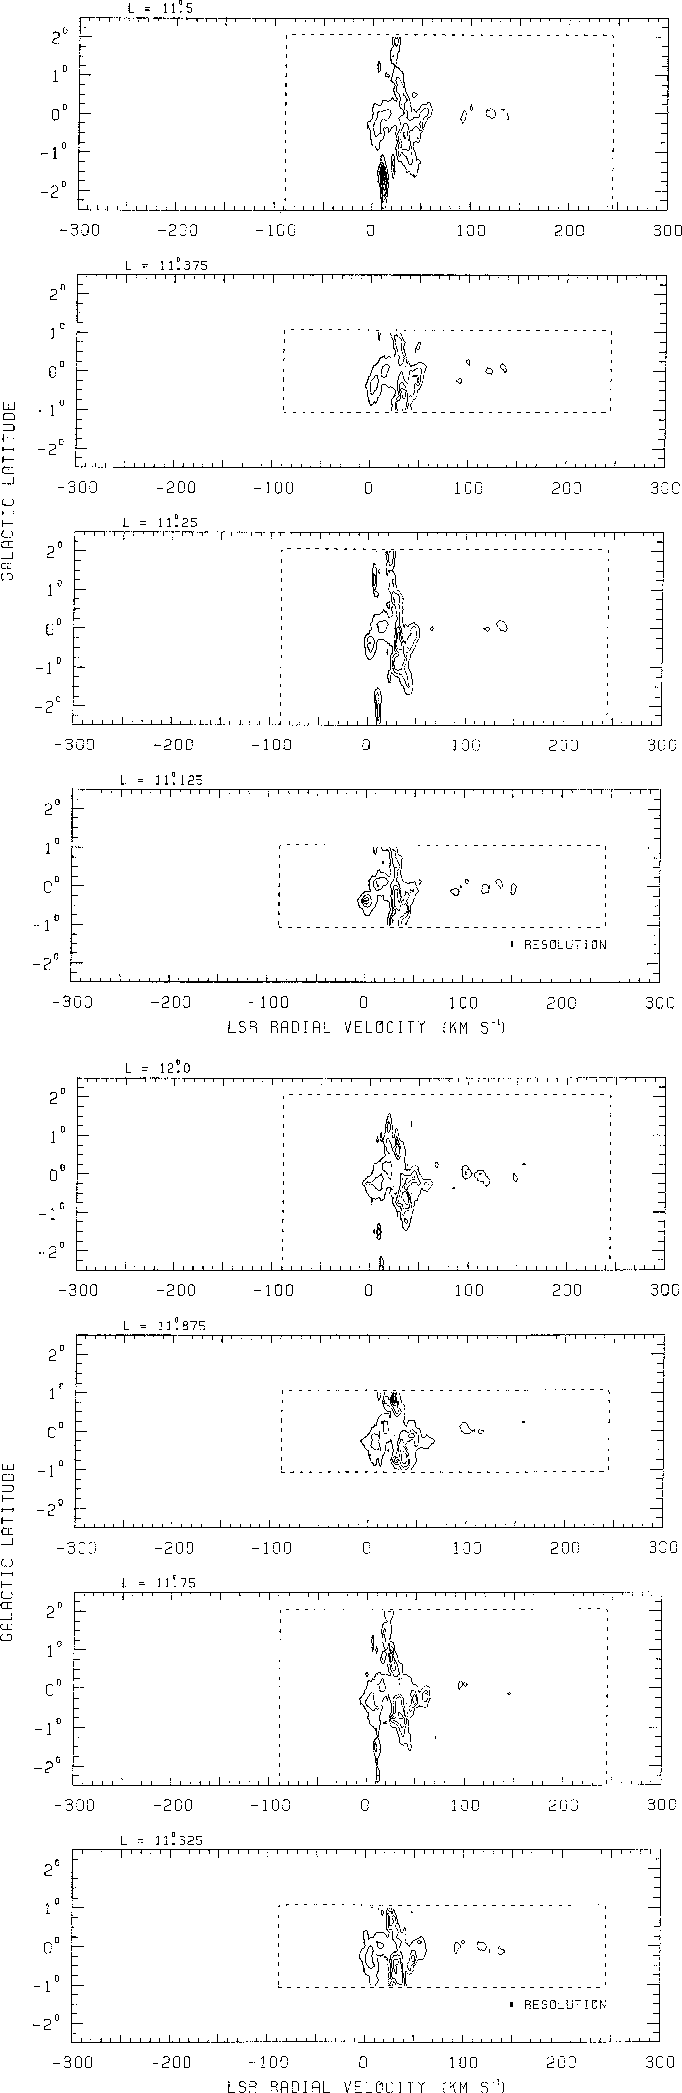
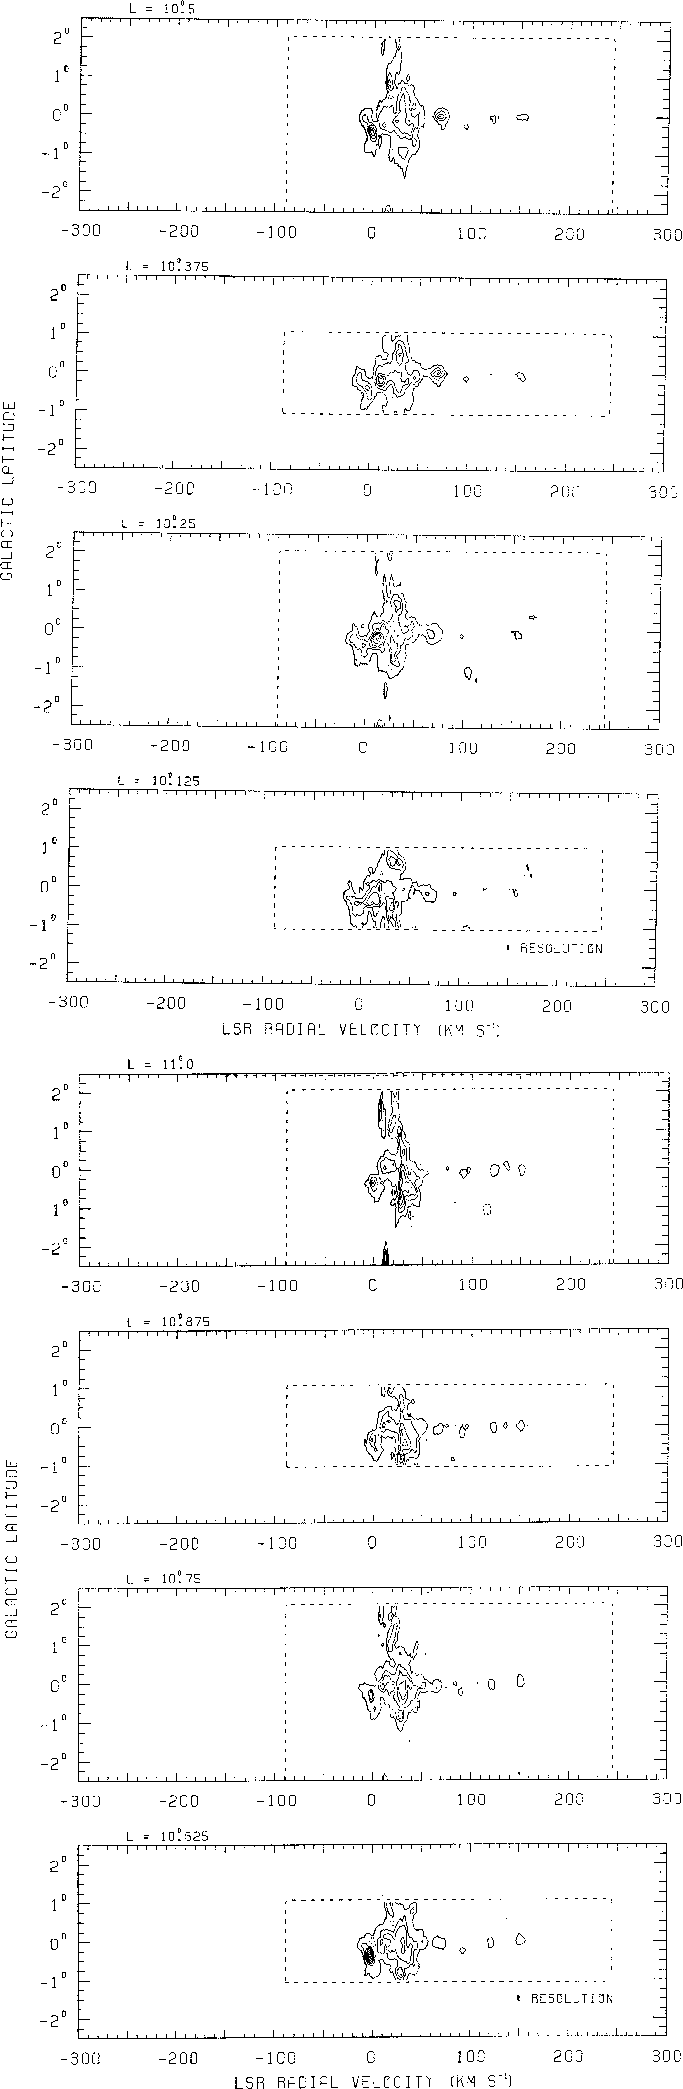

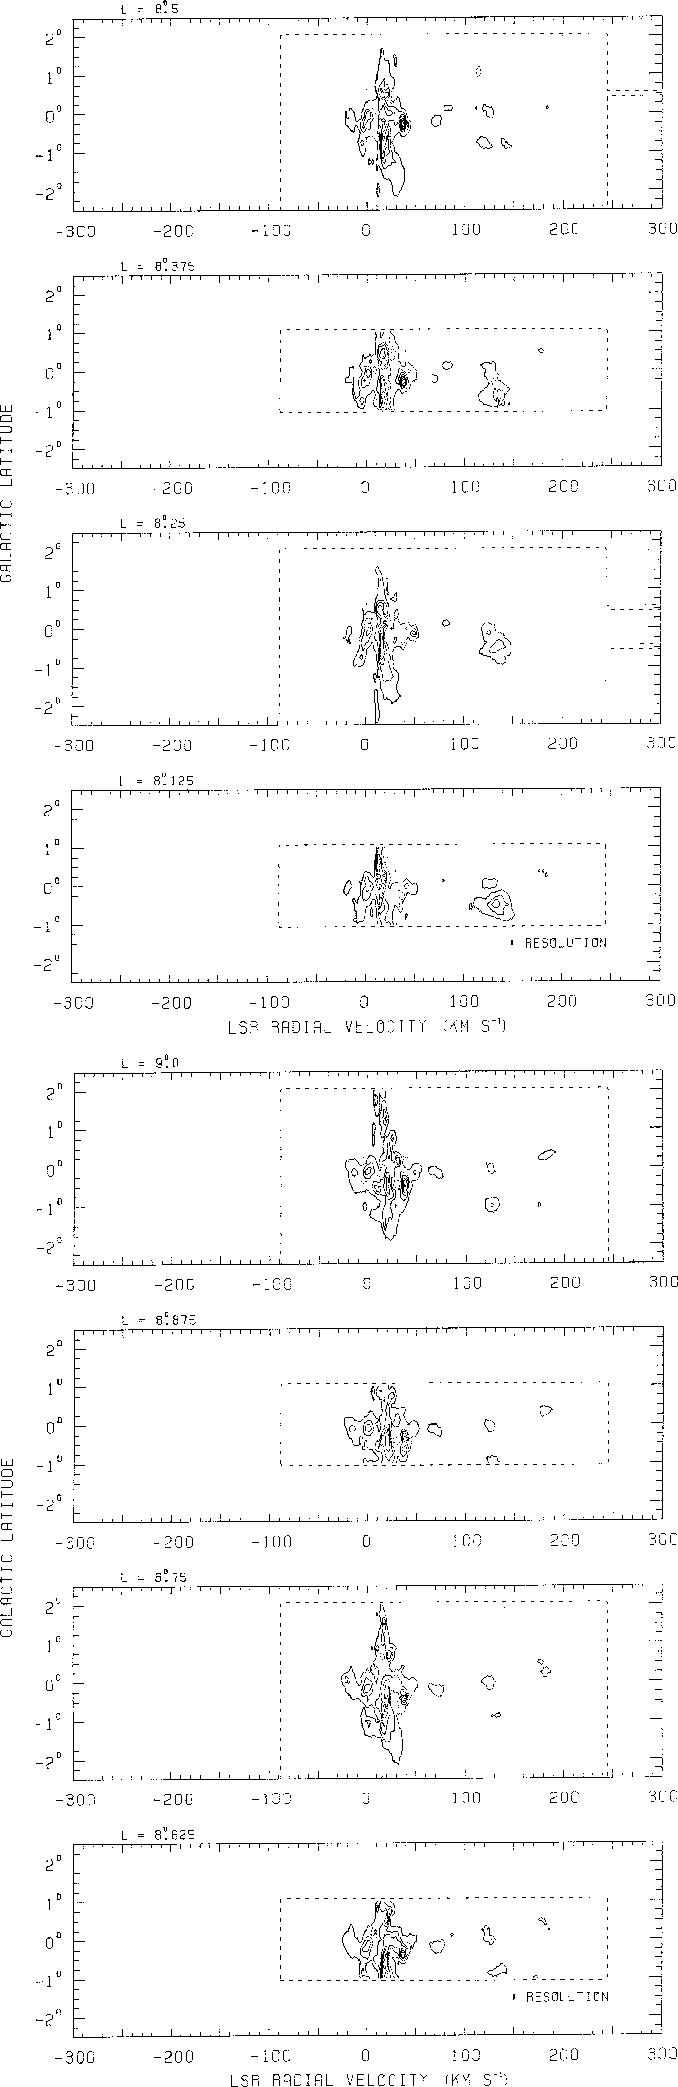
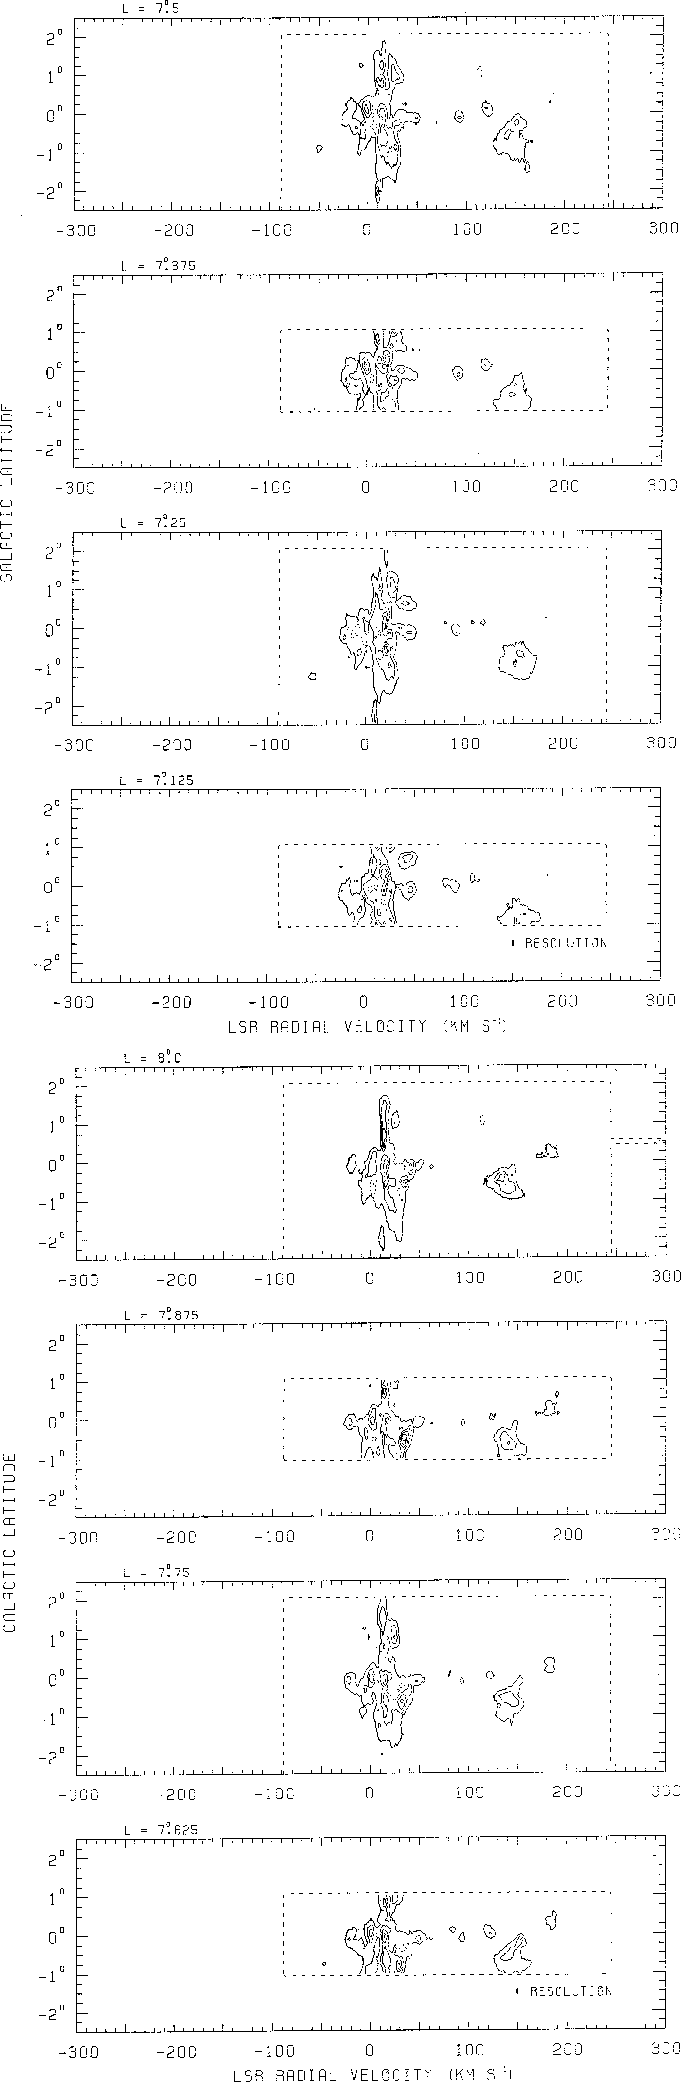
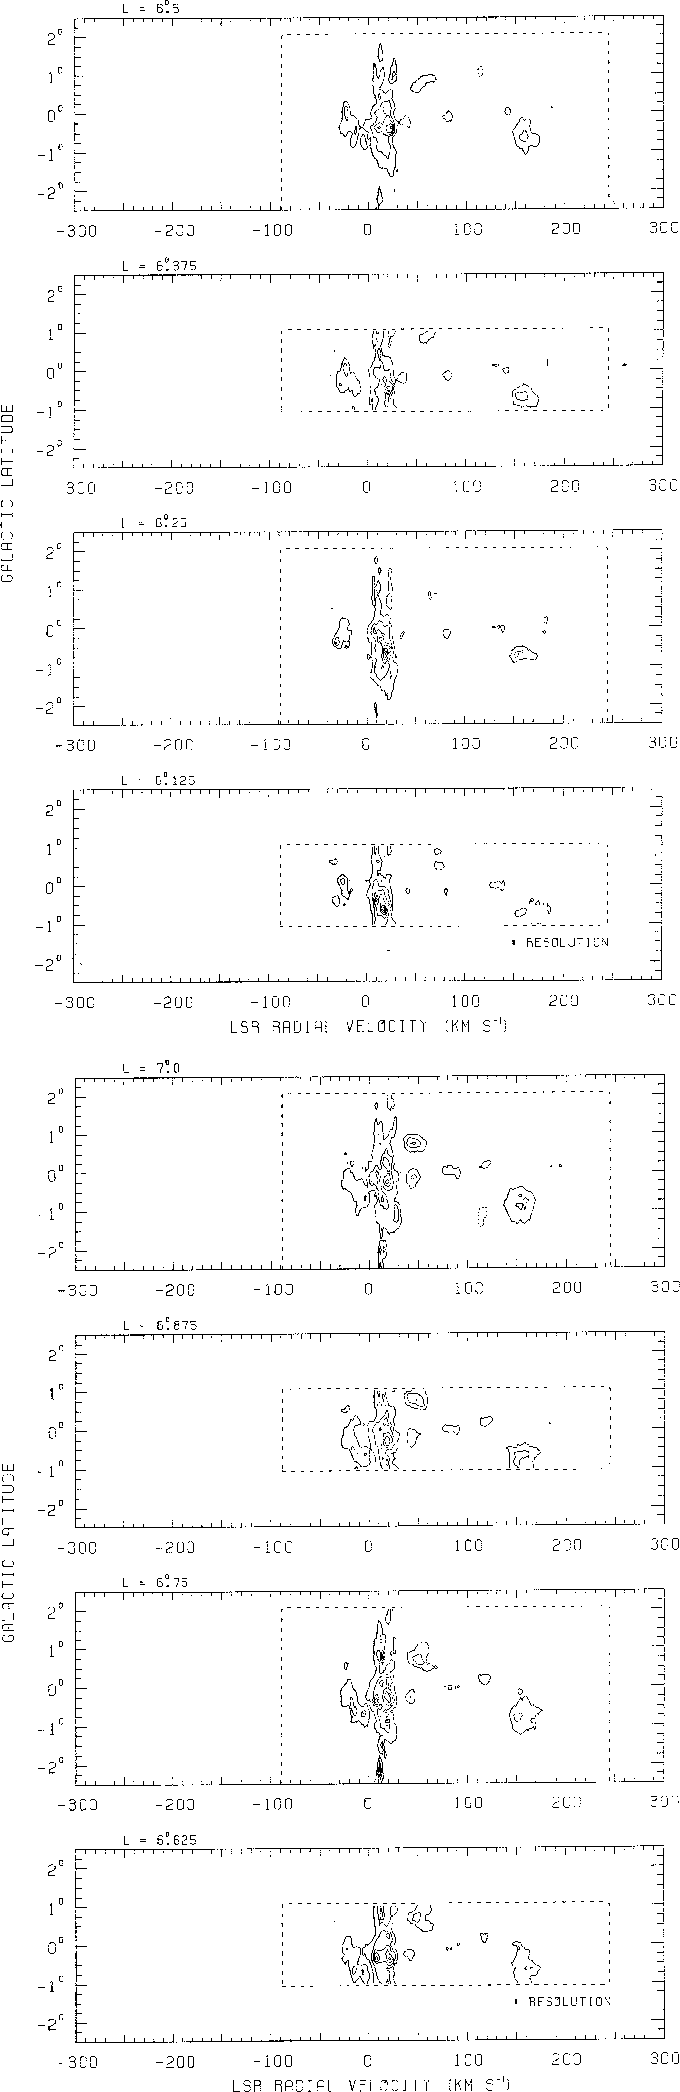
Figure 4: continued
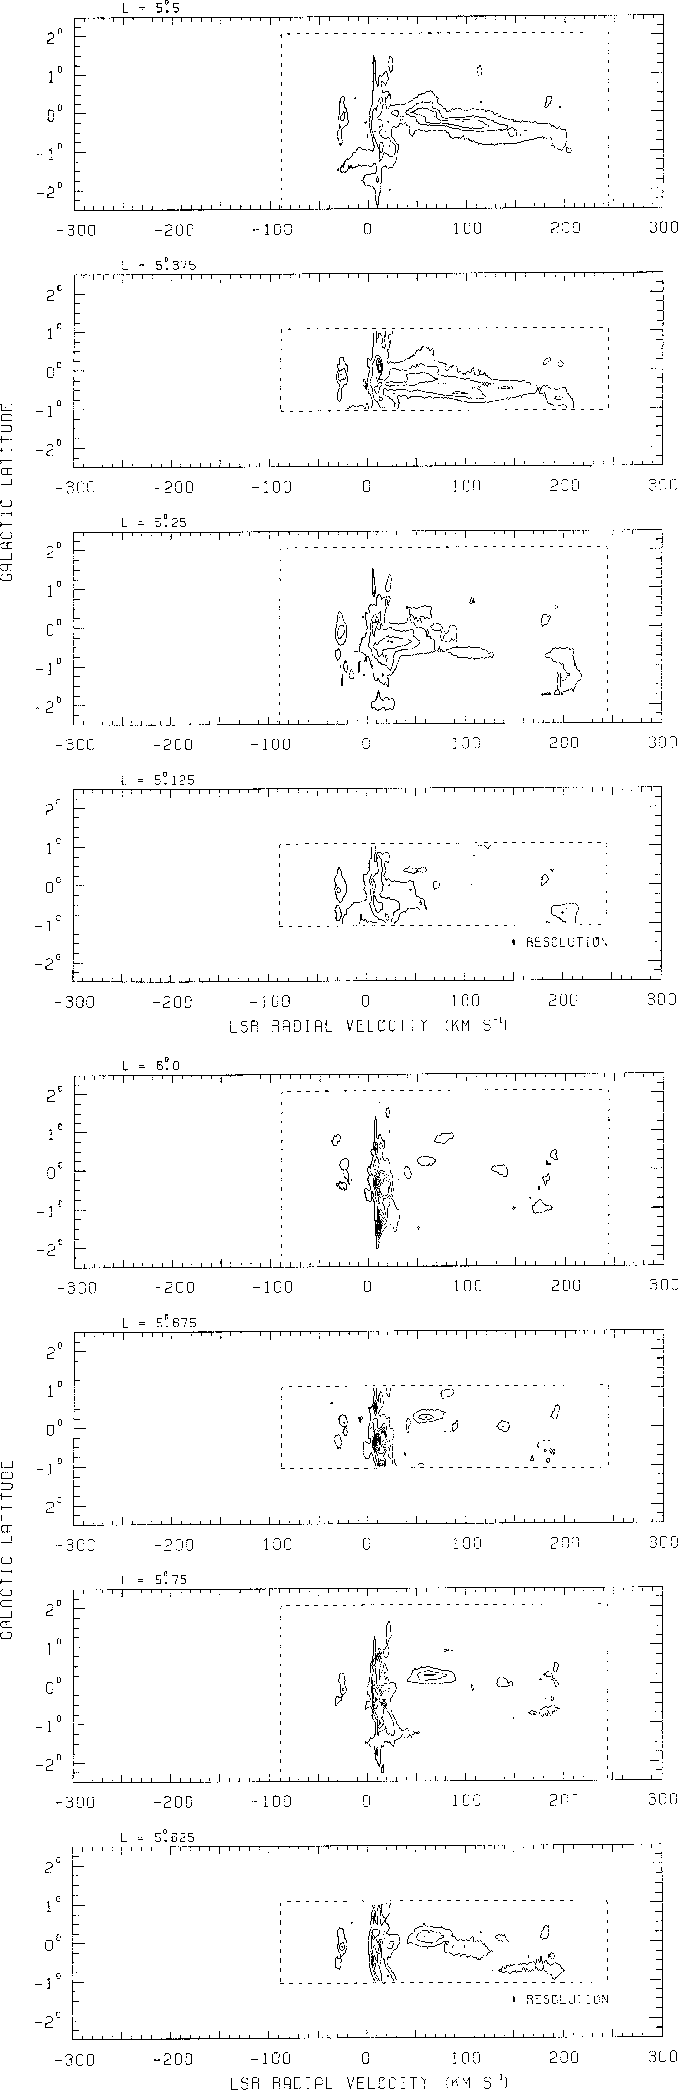
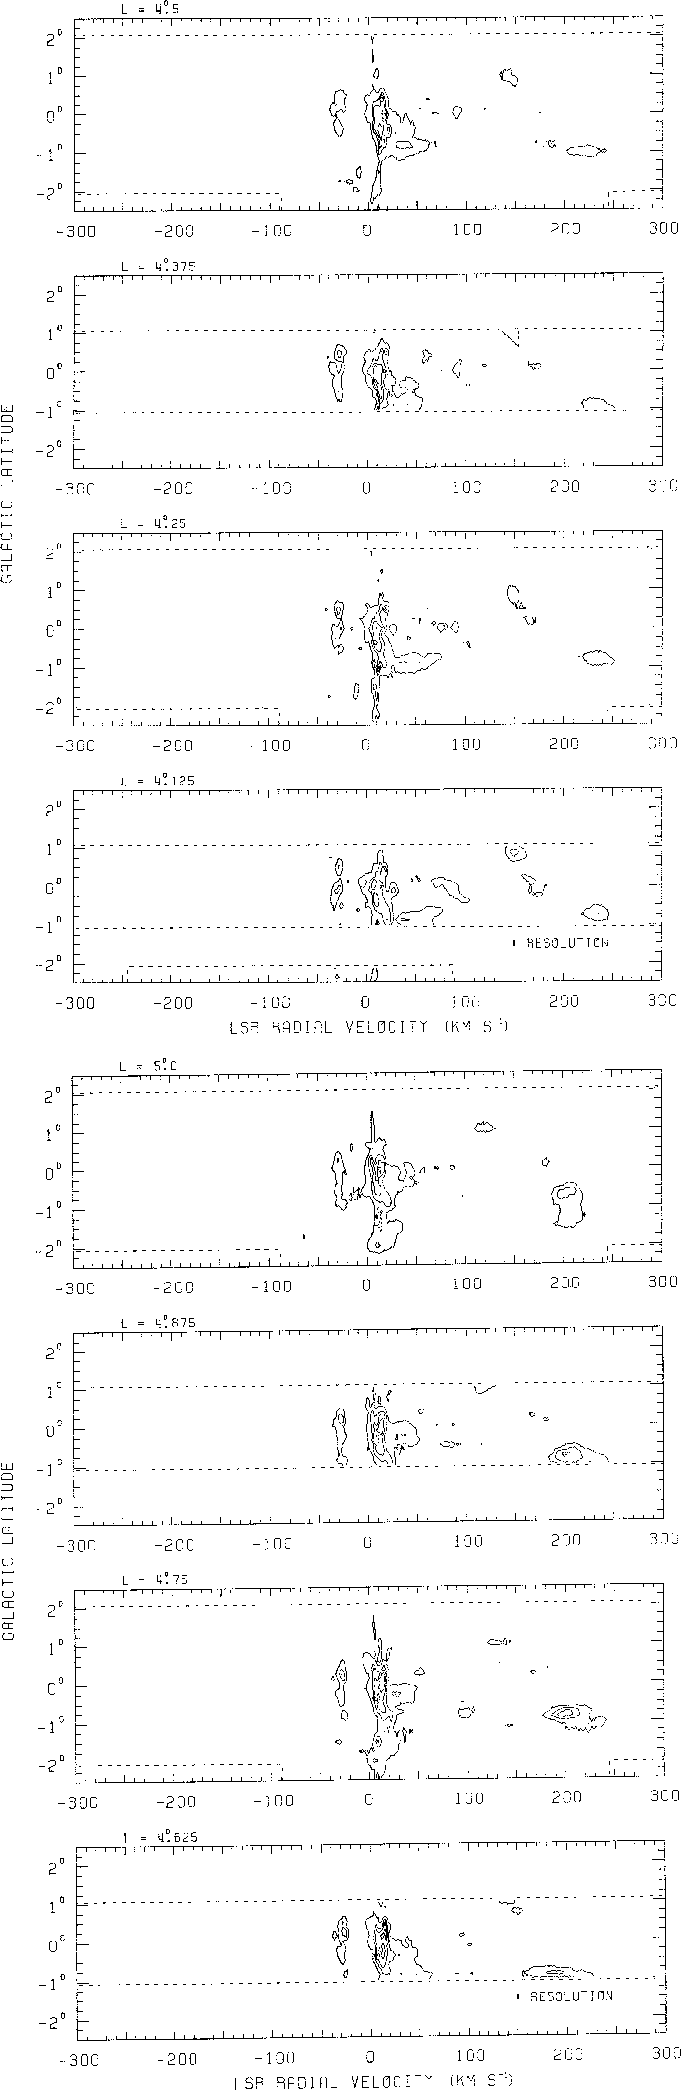
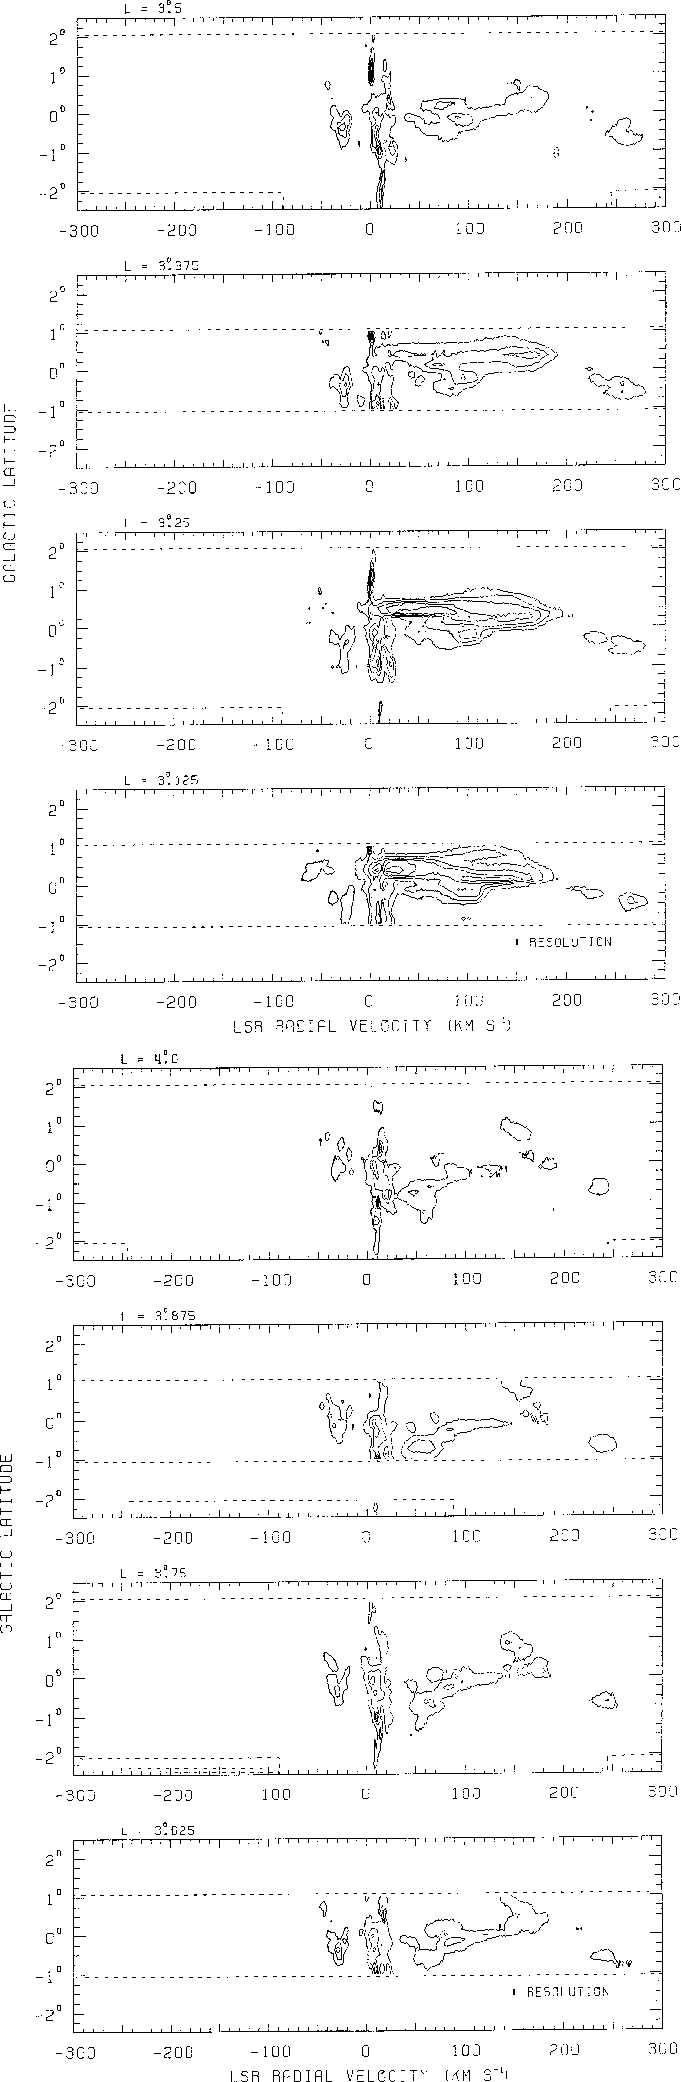
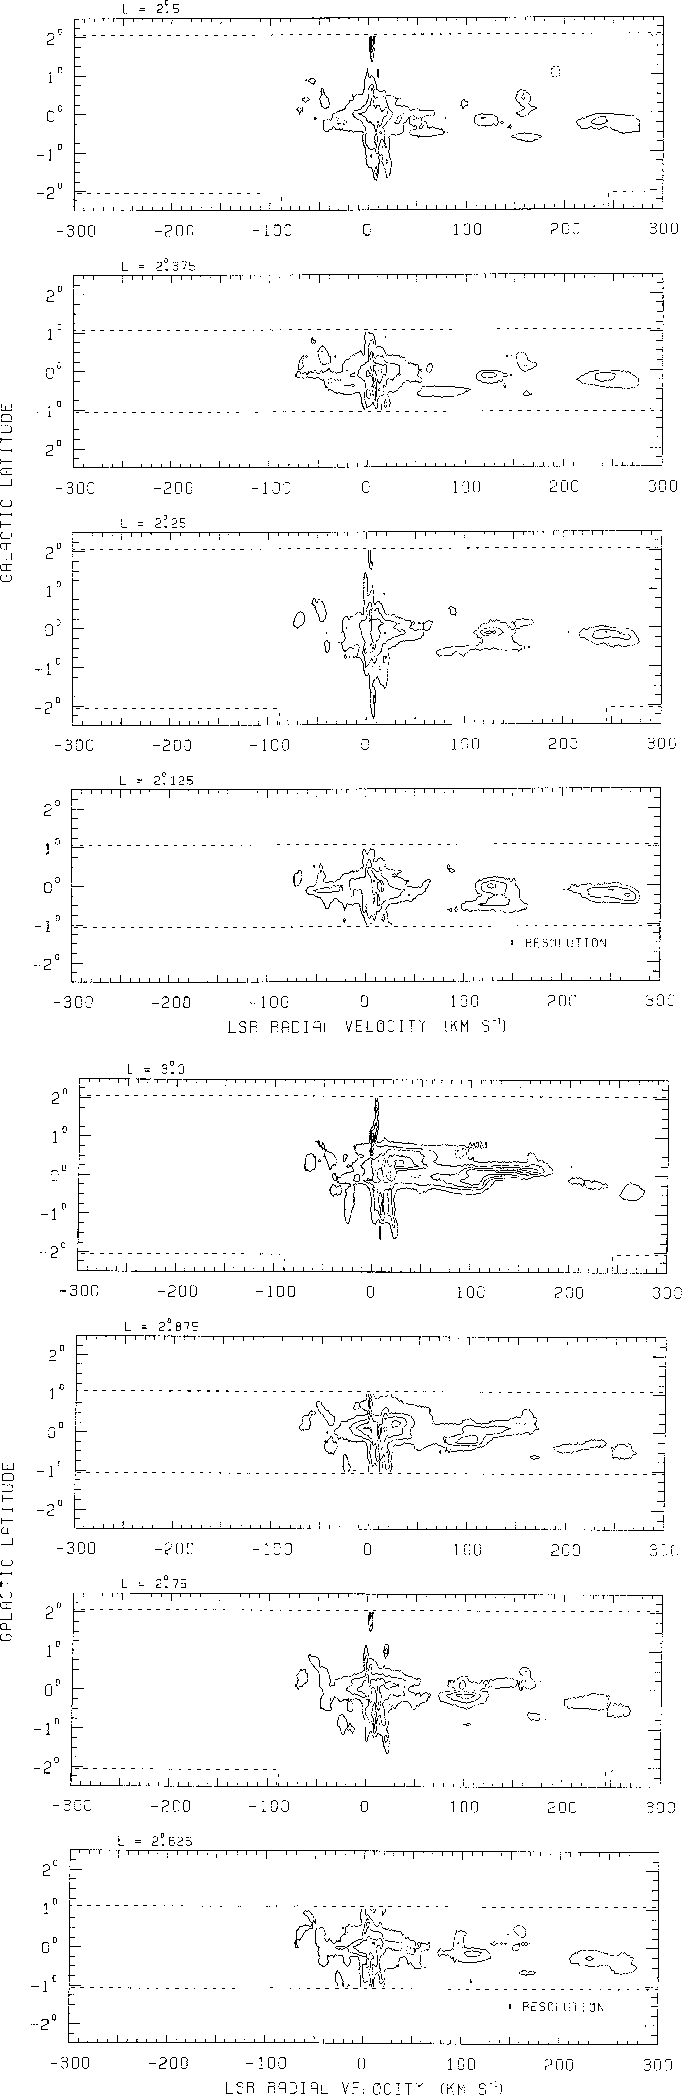
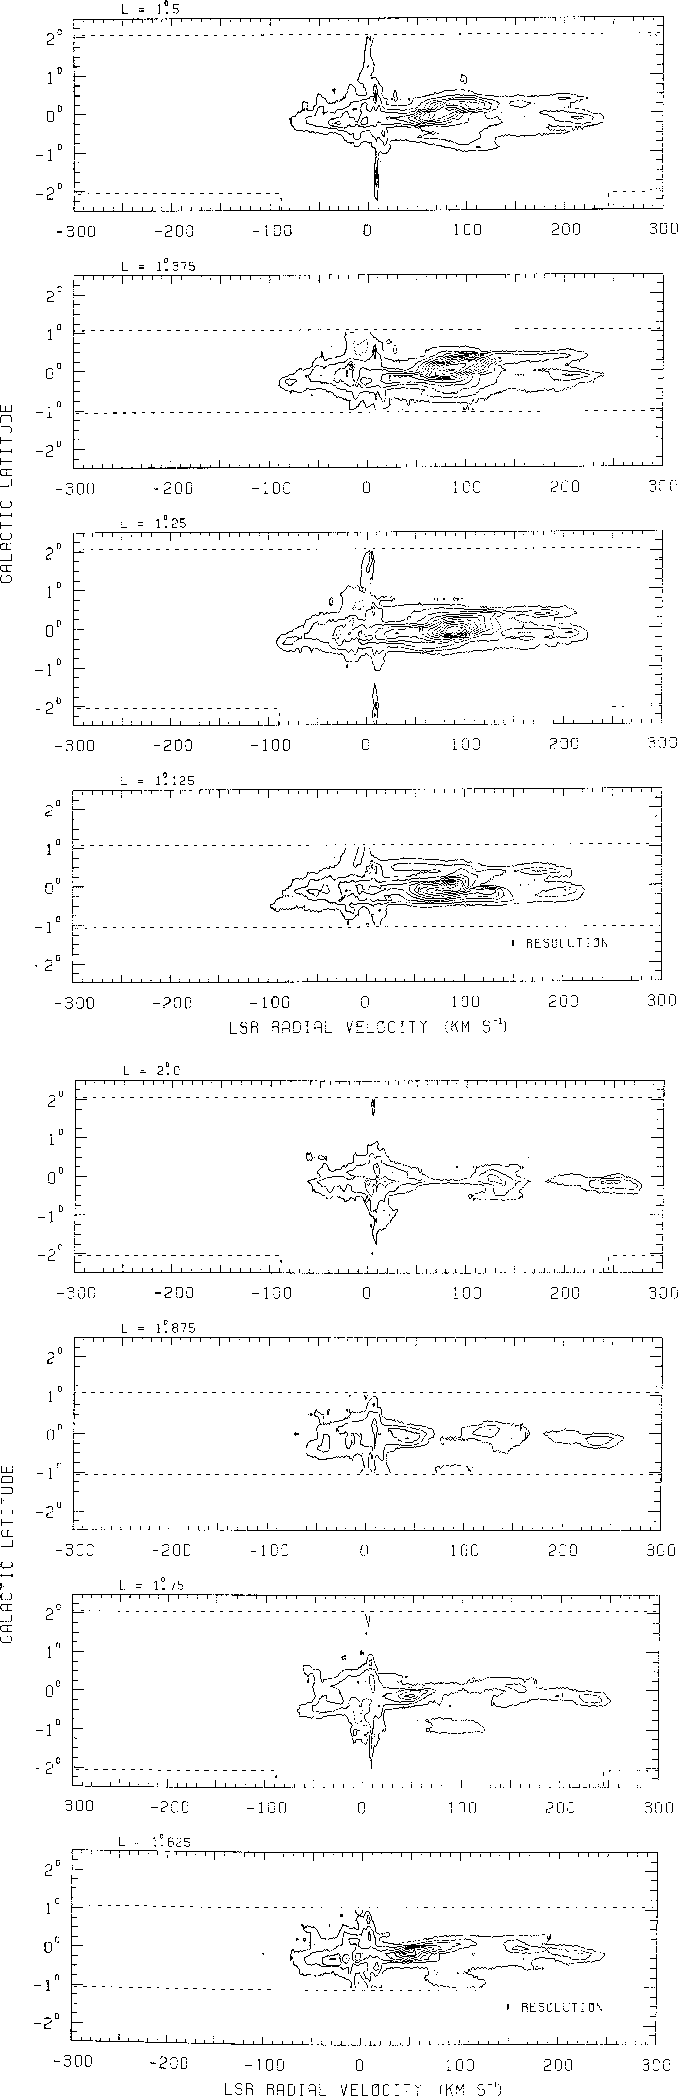
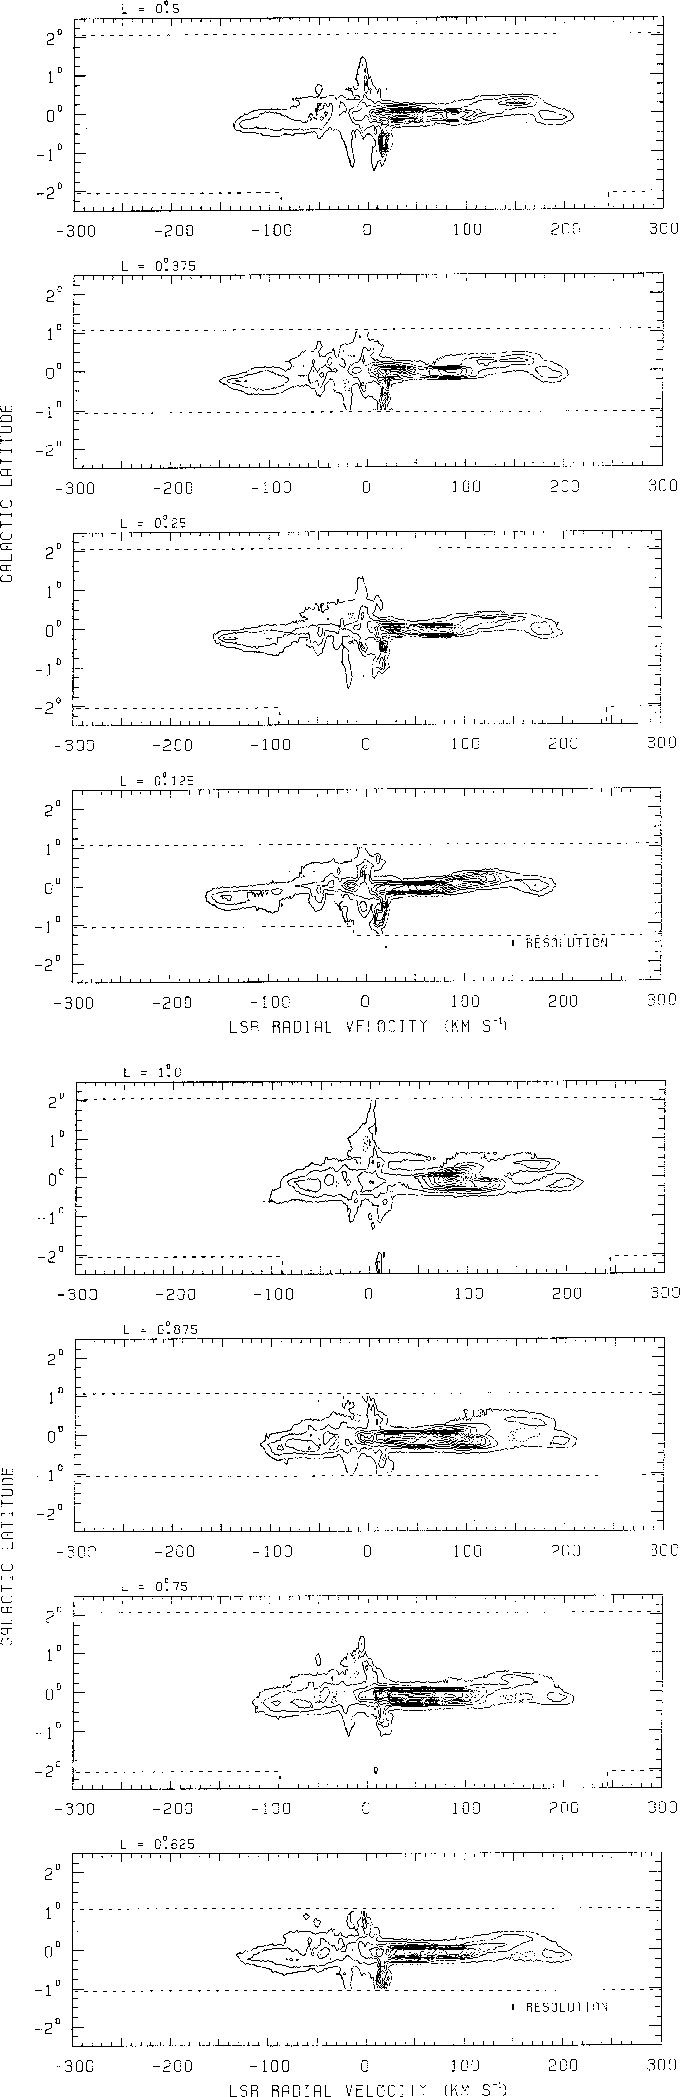
Figure 4: continued
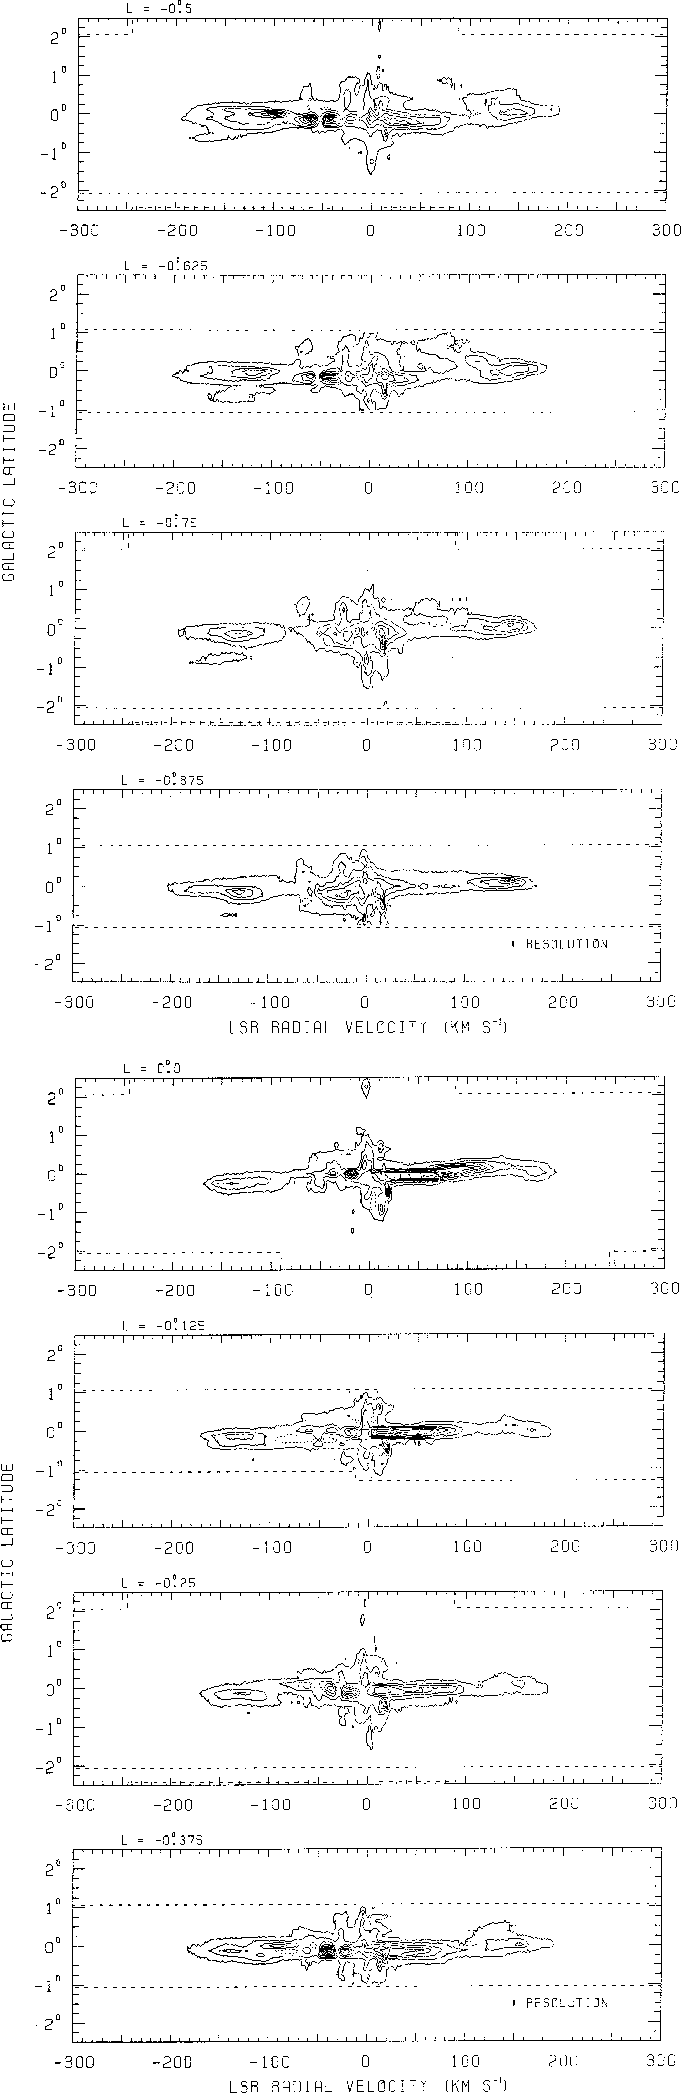
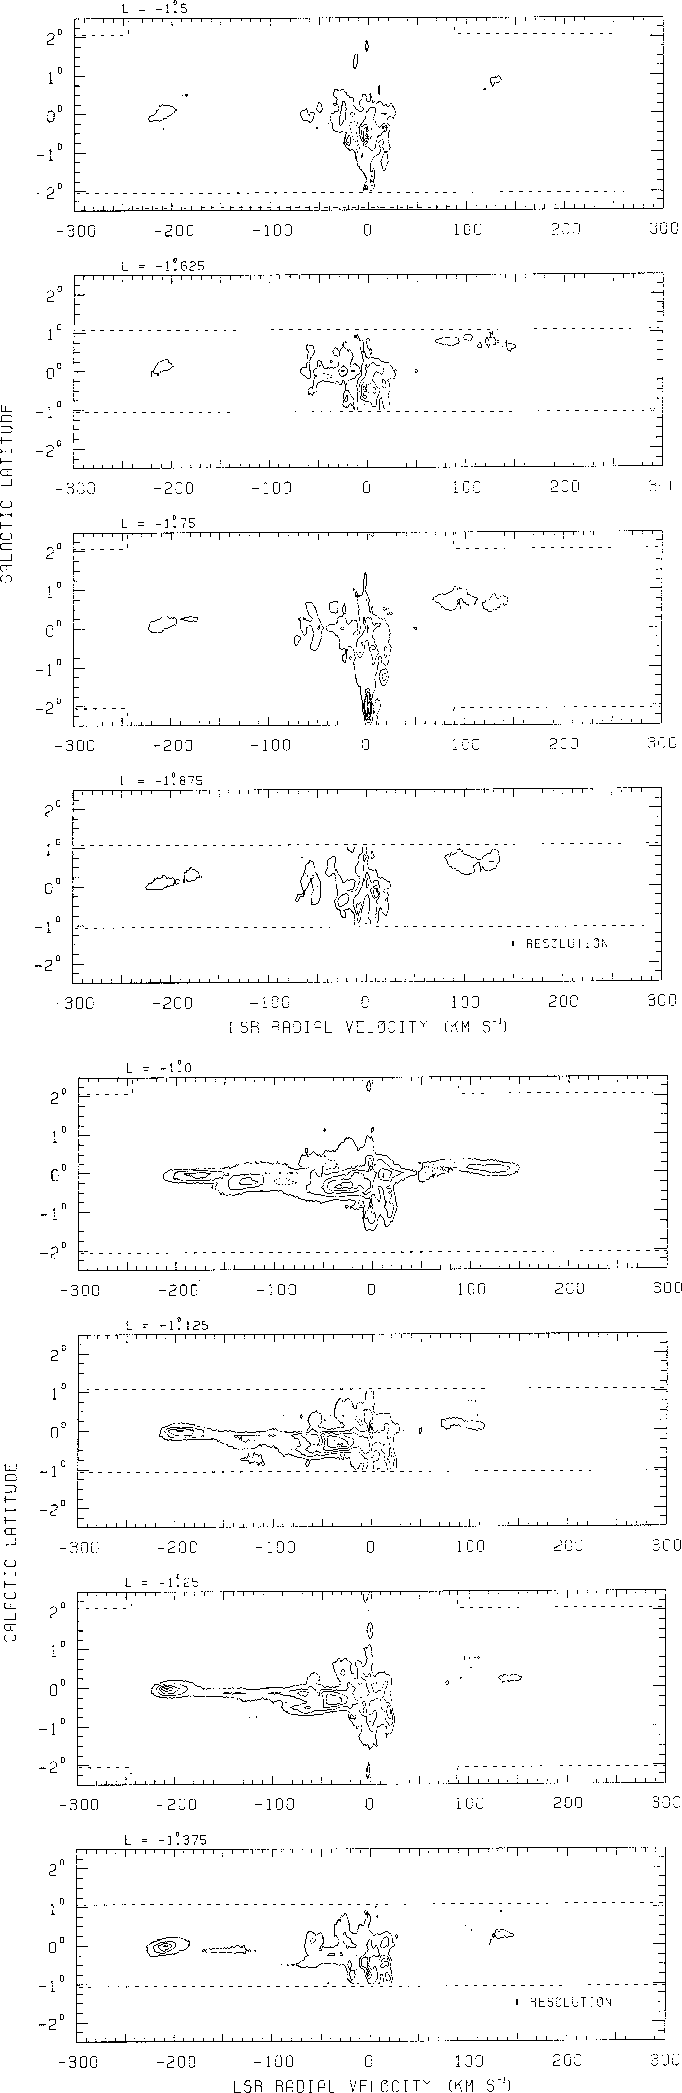
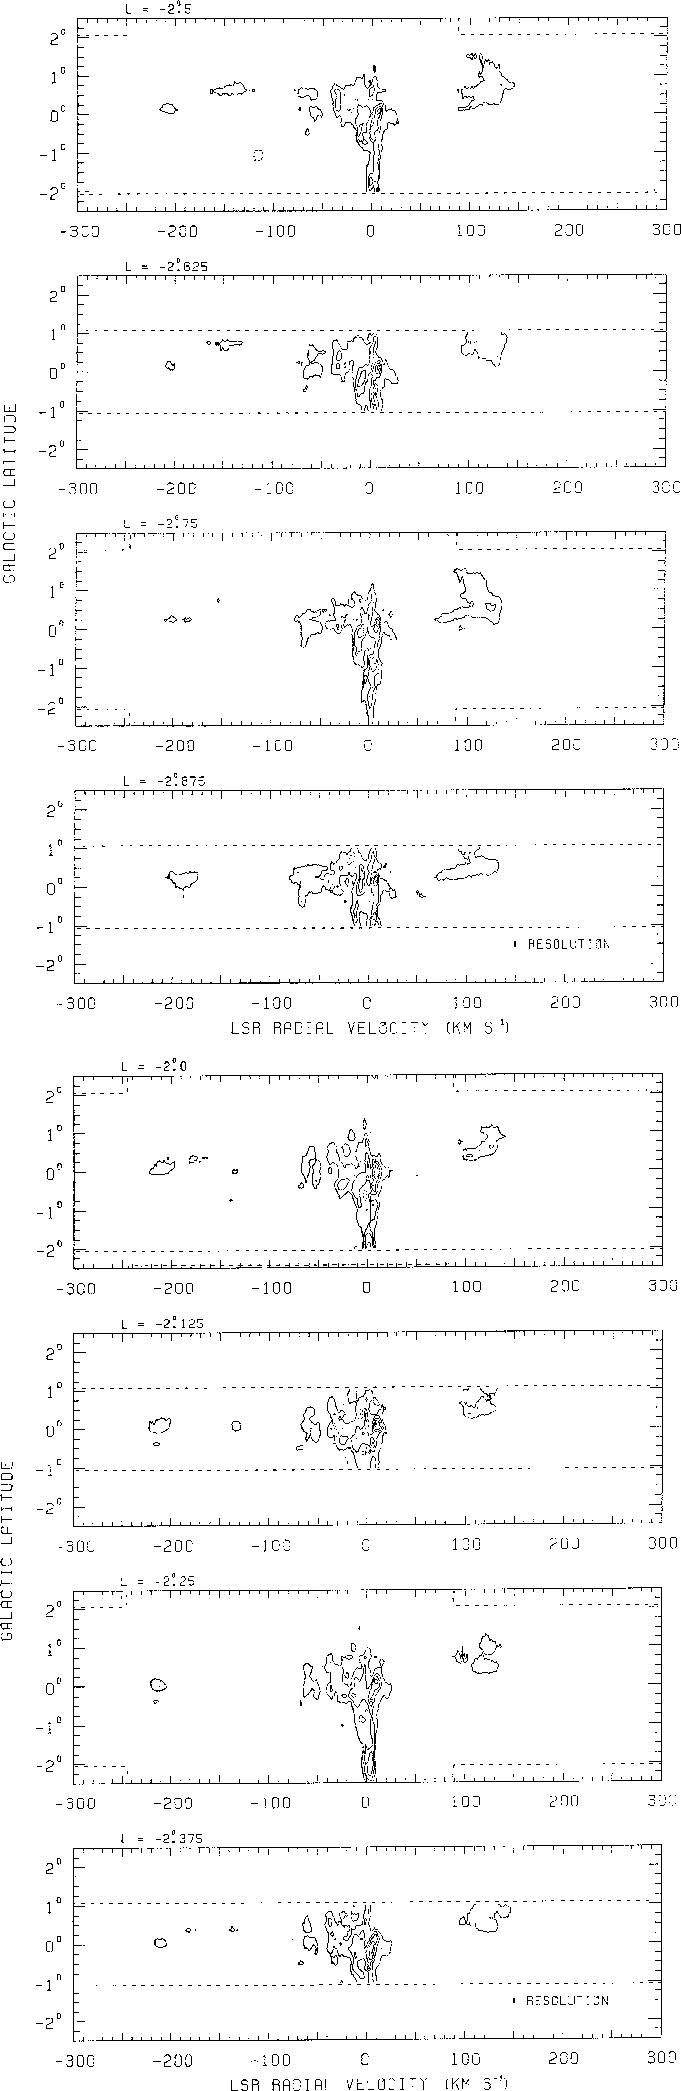
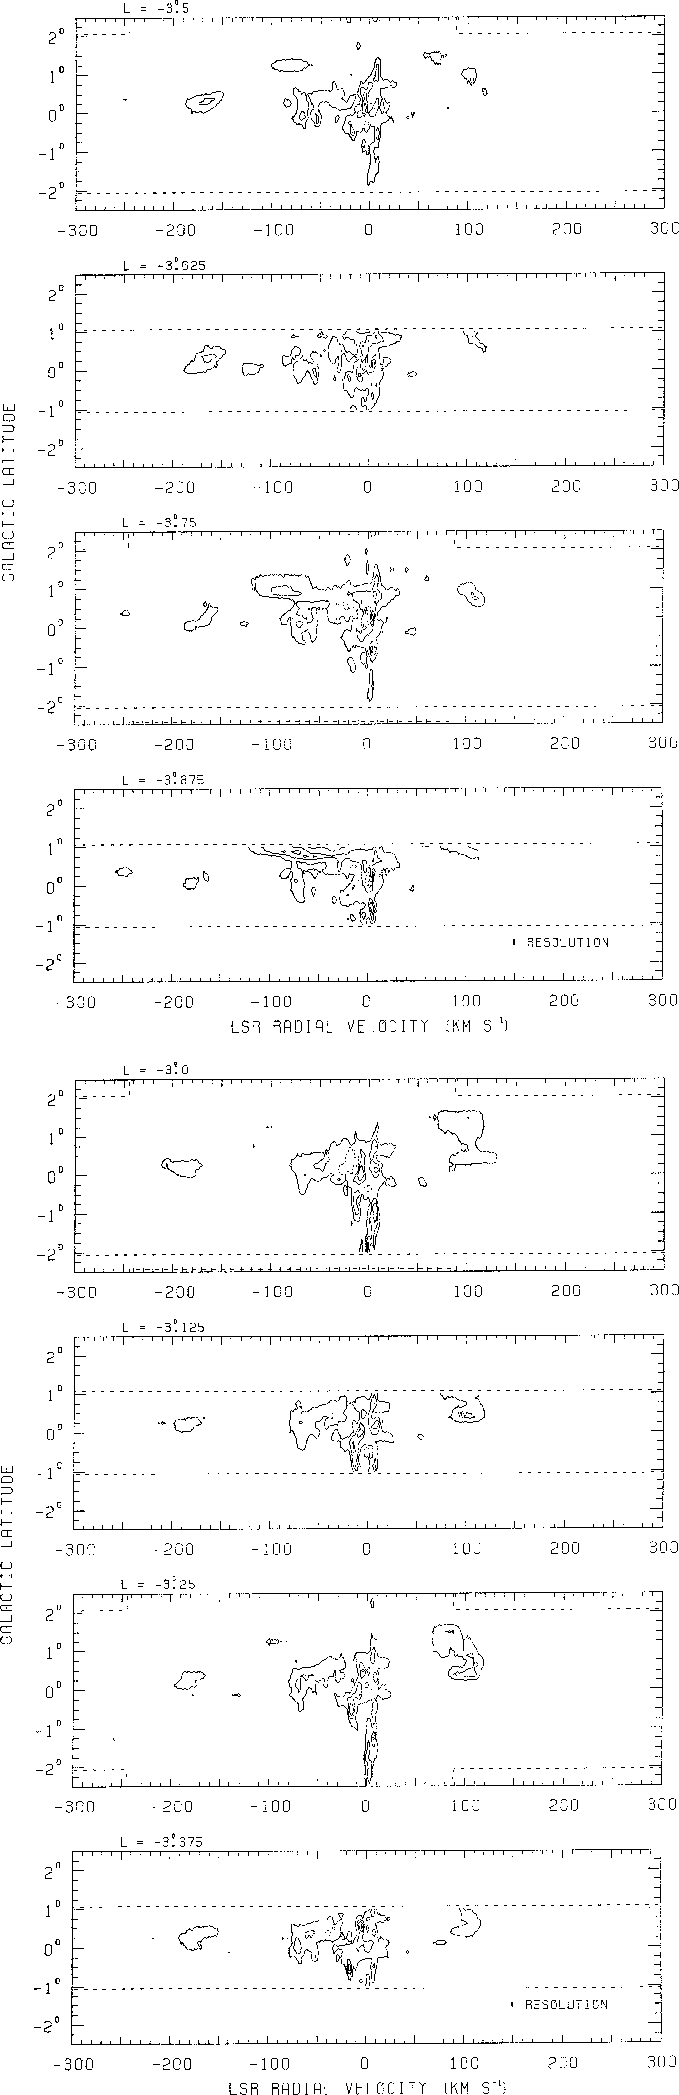
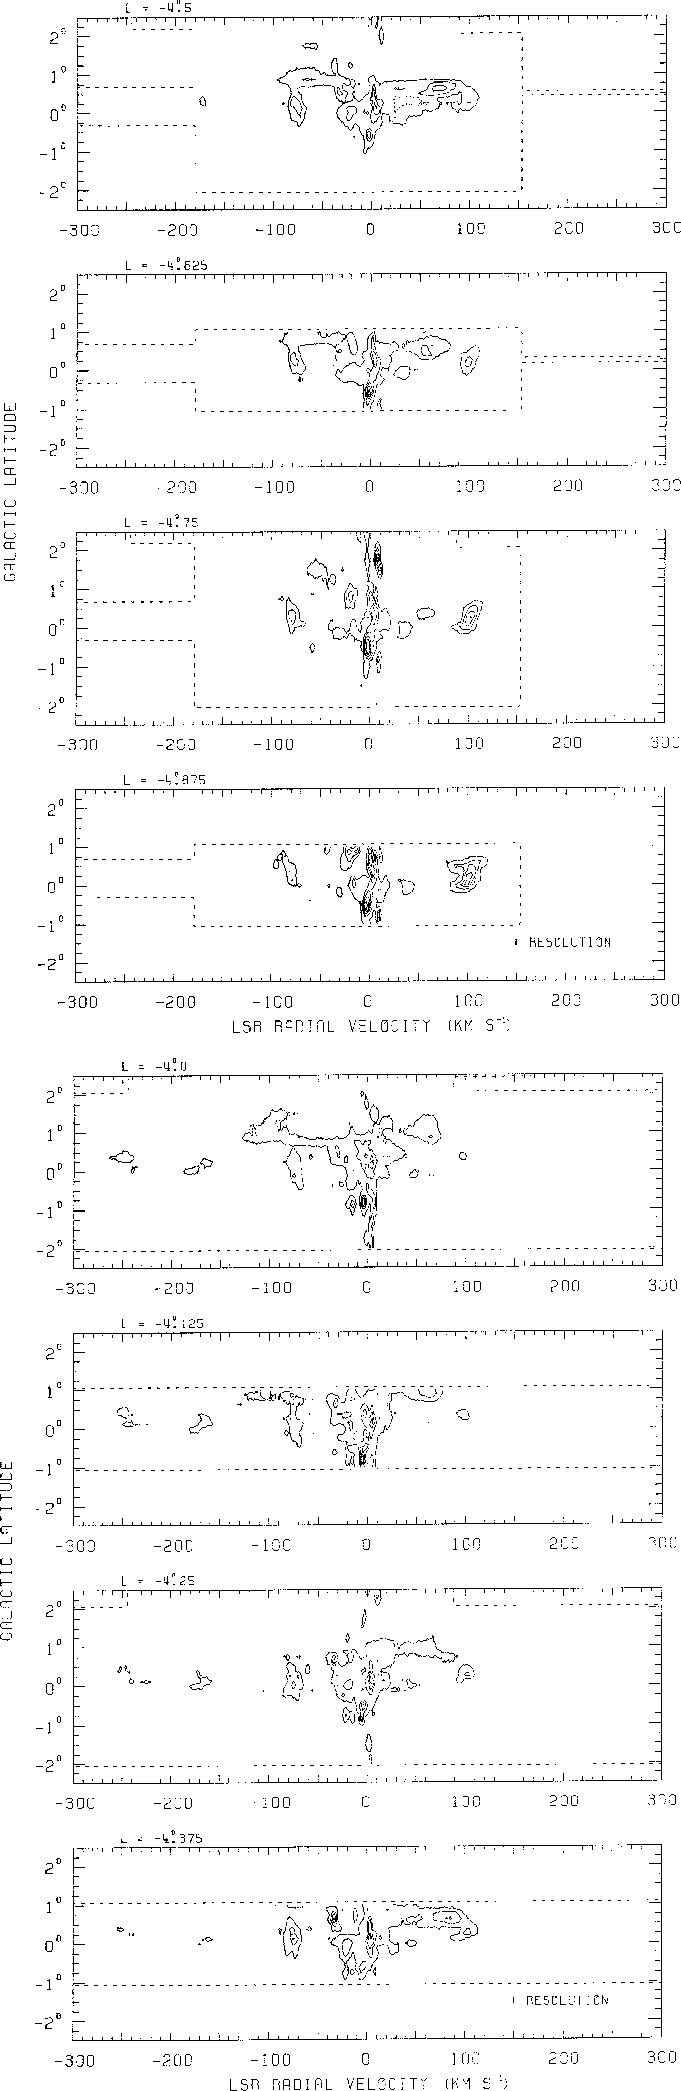

Figure 4: continued
![]()
Figure 4: continued