Since the transmission line network of the Maipu array uses open air tween-lines the observations are very vulnerable to meteorological conditions. This, and other undesirable effects mentioned earlier, meant that we had to observe for 12 years in order to get data of good quality. The ever increasing man-made interference will certainly make low-frequency observations far more difficult, if not impossible, in the future. At this time we are working with Dr. Koitiro Maeda in the processing of 46-MHz data he took in the northern hemisphere with an instrument of characteristics similar to ours. If these data are found to be of quality comparable to that of the present southern survey, we plan to produce an all-sky survey at 45 MHz.
The operating frequency at 45 MHz was chosen because the Chilean government allocated a 3-MHz band centered at that frequency for radio astronomy use only. This proved to be a very convenient choise because we found that it is not too high to be contaminated with thermal emission, nor too low to be affected by thermal absorption (Alvarez et al. 1987). Therefore we believe the survey represents practically pure synchrotron emission.
The survey shows numerous interesting galactic features like arcs, spurs,
filaments and
loops some of which are also seen
at 408 MHz. The most significant difference with Haslam et al. (1982)
survey is that this
shows the maximum
brightness at the galactic centre (![]() ,
, ![]() )
while ours shows it at
)
while ours shows it at ![]() .
A preliminary discussion of this feature has been
presented by us elsewhere (Alvarez et al. 1996).
.
A preliminary discussion of this feature has been
presented by us elsewhere (Alvarez et al. 1996).
The 45-MHz survey should be useful in studying galactic structure and procesess through comparisons with the distribution of high energy particles and magnetic fields, and with surveys at other wavelengths.
Acknowledgements
The work presented here has been accomplished thanks to the collaboration of many people and several institutions. We are particularly indebted to Prof. R. Wielebinski for making available the data processing facilities of the Max-Planck-Institut für Radioastronomie in Bonn, to Dr. P. Reich for helping us in using these facilities, producing the final maps and critically reading the manuscript, to Prof. L. Woltjer for supporting this project while being Director General of the European Southern observatory, and to Prof. T.D. Carr for valuable suggestions regarding the design of the array. This survey could not have been done without the effort, enthusiasm and dedication of F. Reyes, M. Bitran, F. Salas, J. Ventura, H. Repetur, B. Dragicevic, R. Sepulveda, and F. Stefoni, who were involved in different aspects of the project as part of their thesis work. F. Gallardo and the late A. Cardona helped with the telescope maintenance and operation. Throughout its long development this project has been funded through several grants by CONICYT, Universidad de Chile (DTI), and FONDECYT. The European Southern Observatory, the NASA Satellite Tracking Station at Santiago and the University of Florida kindly contributed with equipment and parts. The survey was completed under FONDECYT project 1930750.

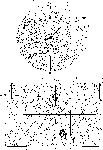
Figure 1: Set of maps of the 45-MHz survey in equatorial
coordinates (Epoch 1950). The explanation of contour levels
and labelling is given in the text. The maps for ![]() are presented in order of
increasing right ascension. A polar plot is given for
are presented in order of
increasing right ascension. A polar plot is given for
![]() . Arrows on contour lines indicate
directions of decreasing temperatures.
. Arrows on contour lines indicate
directions of decreasing temperatures.

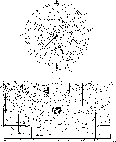
Figure 2: Set of maps of the 45-MHz survey in galactic
coordinates. Contour levels are the same as in Fig. 1 (click here) (see
text). The maps are presented in the longitude ranges
![]() and
and ![]() , and the
latitude ranges
, and the
latitude ranges ![]() ,
, ![]() , and
, and ![]() . Polar plots are
given for
. Polar plots are
given for ![]()
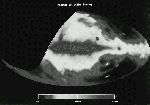
Figure 3: Color coded map of the 45-MHz survey in
galactic coordinates in equal-area projection. The code is shown in
the figure. The contours begin at 30000 K and continue in steps of
10000 K
(NOT AVAILABLE ONLINE)

Figure 4: 45-MHz survey in galactic coordinates in
equal-area projection.