We have continued the survey of main line OH emission in the direction of
IRAS sources, selected with Wood and Churchwell color criterion which allows
to find UC HII candidates in the IRAS point sources catalog. To the
observing list, we added several ![]() masers and IRAS cores. From 182
observed sources, we detected 24 certain and 5
possible OH masers, 51
thermal and 4 absorption sources. The OH flux density of the detected masers is less than
2.5 percent of infrared flux at 60
masers and IRAS cores. From 182
observed sources, we detected 24 certain and 5
possible OH masers, 51
thermal and 4 absorption sources. The OH flux density of the detected masers is less than
2.5 percent of infrared flux at 60 ![]() , which confirms the results of
Cohen et al. (1988), that infrared pumping of OH masers is feasible. No
new OH masers of Ib type were detected. The thermal sources that were detected
are believed to be associated with nearby dark clouds. This is suggested by
their low radial velocities, which in most cases coincide with that of
CO lines. Also, 15 IRAS point sources have associations with IRAS cores in
nearby dark clouds, identified by Wood et al. (1994). This means that IRAS
point sources are connected with OH thermal emission and that the association
is not only accidental.
, which confirms the results of
Cohen et al. (1988), that infrared pumping of OH masers is feasible. No
new OH masers of Ib type were detected. The thermal sources that were detected
are believed to be associated with nearby dark clouds. This is suggested by
their low radial velocities, which in most cases coincide with that of
CO lines. Also, 15 IRAS point sources have associations with IRAS cores in
nearby dark clouds, identified by Wood et al. (1994). This means that IRAS
point sources are connected with OH thermal emission and that the association
is not only accidental.
Acknowledgements
V.I. Slysh, A.M. Dzura and I.E. Val'tts are grateful to the INSU (France), NWO (Netherlands) and Russian Foundation for Fundamental Research (grant No. 95-02-05826) for supporting this project. We thank the staff of Radioastronomy Station in Nançay for their help with observations and the referee Dr. R.J. Cohen for useful comments.

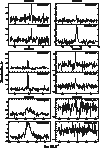
Figure 1: 1-6). Detected masers. Frequency and polarization are
marked in the upper right corner of each figure. When no polarization is
specified, the spectrum is an average of the right and left hand circular
polarizations

Figure 1: 7-12). Detected masers

Figure 1: 13-18). Detected masers

Figure 1: 19-24). Detected masers

Figure 1: 25-30). Detected masers

Figure 1: 31-36). Detected masers

Figure 1: 37-42). Detected masers

Figure 2: 1-6). Thermal sources. Frequency is
marked in the upper right corner of each figure. Spectra are averages of
the right and left hand circular polarizations

Figure 2: 7-12). Thermal sources

Figure 2: 13-18). Thermal sources

Figure 2: 19-24). Thermal sources

Figure 2: 25-30). Thermal sources

Figure 2: 31-36). Thermal sources

Figure 2: 37-42). Thermal sources

Figure 2: 43-48). Thermal sources

Figure 2: 49-54). Thermal sources

Figure 2: 55). Thermal sources