As mentioned before, the spectral classification was carried out along the traditional lines, with the help of the criteria discussed in Paper I. We would like to stress the point that the criteria were not applied blindly, but that all features of the spectrum were examined.
In the course of the classification we have found two facts which merit some comments. The first is that in the composite spectra we have found a slight decrease of the equivalent widths of the features, which is due to the presence of the hot component. Even if the cool component is a supergiant, which has sharp lines, the decrease exists.
The second fact is that if the cool star is of luminosity class III or IV, the presence of the hot companion is signaled usually by the presence of Paschen lines (which are more or less important according to its spectral type). If the Paschen lines are present, they enhance to a certain degree the values of the equivalent widths of the CaII lines of the infrared triplet. On the other side the continuum is also enhanced, which produces a flattening of the lines, and these two effects tend curiously to cancel out mutually.
In view of the preceding comments we can naturally ask ourselves on the consistency and the accuracy of our classifications. We have controlled our results in four different ways, namely:
In what follows we shall examine each point separately.
As we have remarked before, classifications of composites are not frequent and if several do exist for the same object, they usually disagree widely. Nevertheless the composites analysed by R. & R. Griffin with the so called "substraction method" (Griffin 1986) can be considered as being well classified, but this lengthy method applies only to bright objects; we have used some of these as "standards". To these objects we can add three MK standards whose composite nature is well established and some other stars such HD 29094 classified by Harmer et al. (1983) on the basis of a spectrophotometric study which includes IUE observations. Our list of "standards" composites comprises thus eleven objects, given in Table 3 (click here). In this table we provide the classifications given by the different authors and by ourselves (for the cool components). As can be seen, the agreement is as close as it can be expected.
In certain cases we have widely separated binaries for which we can obtain separated spectra of the components, but we can also obtain a "single" spectrum by defocusing the telescope. We have observed two systems of this type, HD 18715 (Sep. 8'') and HD 24554-5 (Sep. 6.8''). In both cases the classification of the cool component from the combined spectra is identical to the classification of the star if observed separately.
As pointed out before, we ignore precisely how much the equivalent widths are influenced by the presence of the companions. To come around this difficulty, we can use the ratio of the central depths of two nearby lines of TiI (8683) and FeI (8679), which should be affected similarly by the continuum background. For the standard stars, this ratio (R) is a spectral type indicator, with a small luminosity effect only for supergiants.
Let us recall below the R - spectral type mean relations (cf. Paper I):
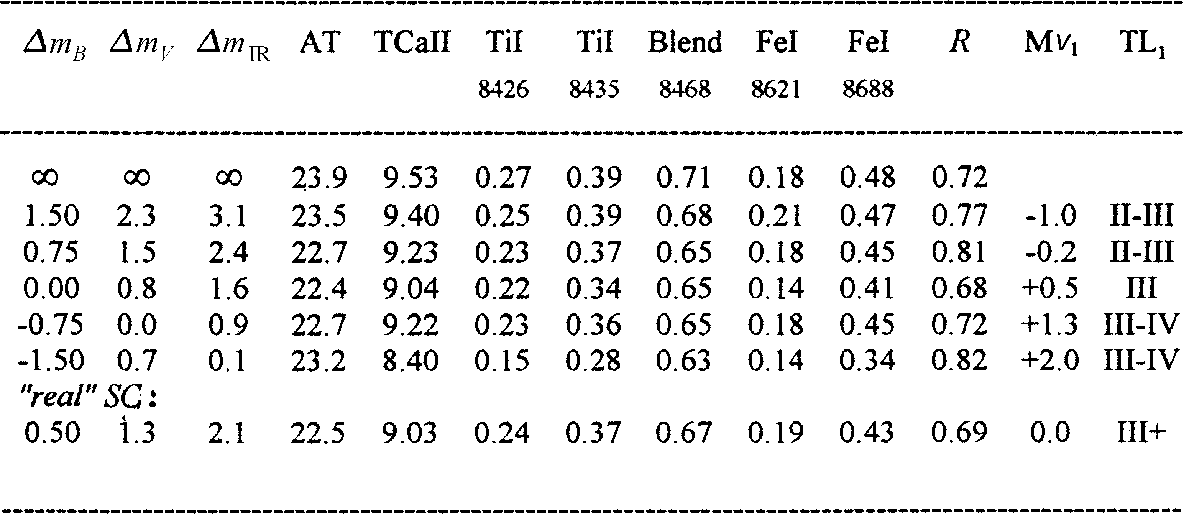
We can then plot the values of R, instead of the spectral types (assumed unknown for the composites), against the different equivalent widths used for classification work. We produce the plots separately for both the standards stars (average curves, the original values are given in Paper I) and the composite spectrum stars. If the influence of the secondary spectrum in composite spectra were important, one would expect to see a relation which differs from those in the plots of standard stars. If, on the contrary, the influence is small, then the distribution should be the same in both figures. The plots are provided in Figs. 1 (click here) to 5 (click here): the upper part refers to the standards and the lower part to the composites. One can see that the relations for the standards and the composites are similar. For luminosity class III the average curves are the same, which agrees with what we said formerly on the compensation between the two opposite effects (one increasing the equivalent widths, the other enhancing the continuum). For classes II and I the hydrogen lines of the hot companion are no longer seen, but the influence of the continuum still exists. The consequence is that the equivalent widths are diminished, which produces a lowering of the average relation.
The figures show also a strong concentration of the cool giants for values of 0.60< R <0.95 which corresponds to the interval G7 to K1, with a maximum at about G8. There do not practically exist giants beyond the G7 - K1 interval. For class II the ratio falls in the interval 0.65< R <1.40 which leads approximately to G7 and K3. Class I shows all spectral types between G0 and M, but we should remember that R is not reliable for M type stars.
As expected, dwarfs are missing among the cool components of composite stars.
One last comment should be made with regard to the classification criteria. It can be seen from an examination of the plots that the criteria provided have different uses. For spectral type one can use AT (Fig. 1 (click here)) and TiI 8435 (Fig. 4 (click here)), for the whole range from G to M type; AT is more valuable for luminosity classes I and II, whereas TiI 8435 is valid for all luminosity classes.
The other criteria are mostly useful for the determination of luminosity class and/or for a limited range in spectral types. As an example one can consider the blend 8468 (Fig. 3 (click here)) which is interesting for luminosity classes I, II and III and types earlier than K5.
Hynek (1938) and Markowitz (1969) have used artificial composites to compare with the real
composites. To obtain these spectra they have superposed the photographic
spectrum of a hot star
(exposure time ![]() ) and a cool star (exposure time
) and a cool star (exposure time ![]() ). Varying the
ratio
). Varying the
ratio ![]() to
to ![]() one can simulate the
effect of various differences of magnitude between the components.
one can simulate the
effect of various differences of magnitude between the components.
We have used the same technique on the system HD 24554-5 (ADS 2850) which has components of types G8III and A2V. This is a type of combination which occurs rather frequently. The angular separation of 6'' permits to observe the components (even under bad seeing conditions) both separately or jointly, if the telescope is defocused. The results are given in Table 4 (click here).
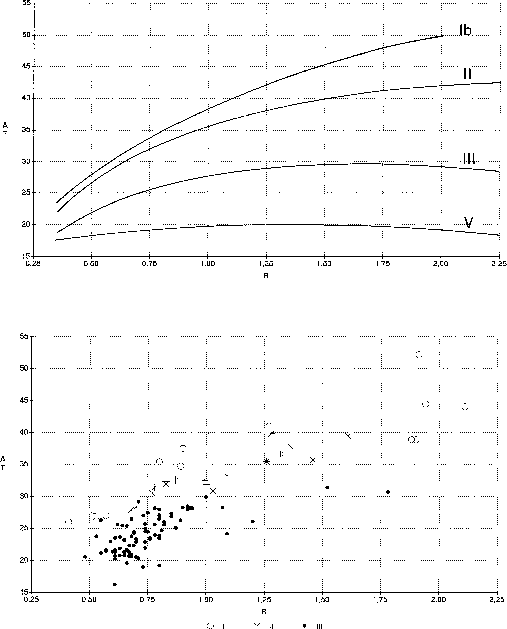
Figure 1: Equivalent width (in Å) of the total absorption between ![]() 8390 and
8390 and ![]() 8775 versus R (related
with the spectral type) for the MK standards (top) and for the composite
spectra (bottom).
8775 versus R (related
with the spectral type) for the MK standards (top) and for the composite
spectra (bottom). ![]() : giants; *:
bright giants;
: giants; *:
bright giants; ![]() : supergiants
: supergiants
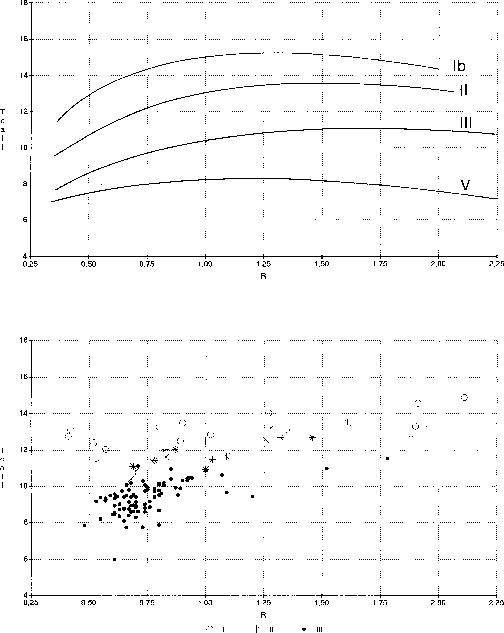
Figure 2: Equivalent width (in Å) of the CaII triplet versus R
(related with the spectral type) for the
MK standards (top) and for the composite spectra (bottom). ![]() :
giants; *: bright giants;
:
giants; *: bright giants; ![]() : supergiants
: supergiants
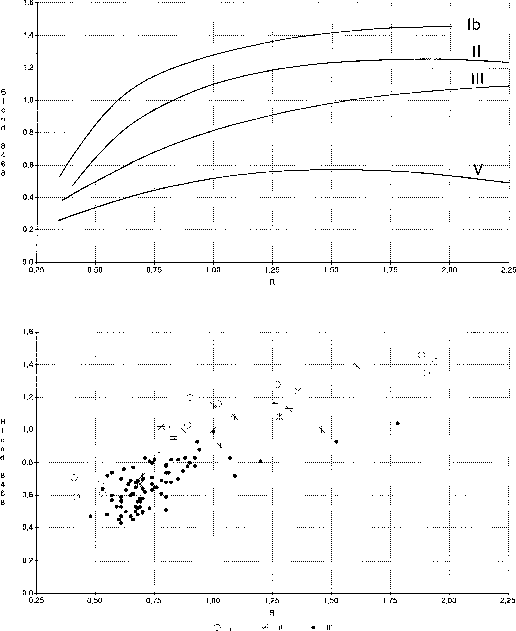
Figure 3: Equivalent width (in Å) of the ![]() 8468 blend
versus R (related with the spectral type) for the
MK standards (top) and for the composite spectra (bottom).
8468 blend
versus R (related with the spectral type) for the
MK standards (top) and for the composite spectra (bottom). ![]() :
giants; *: bright giants;
:
giants; *: bright giants; ![]() : supergiants
: supergiants
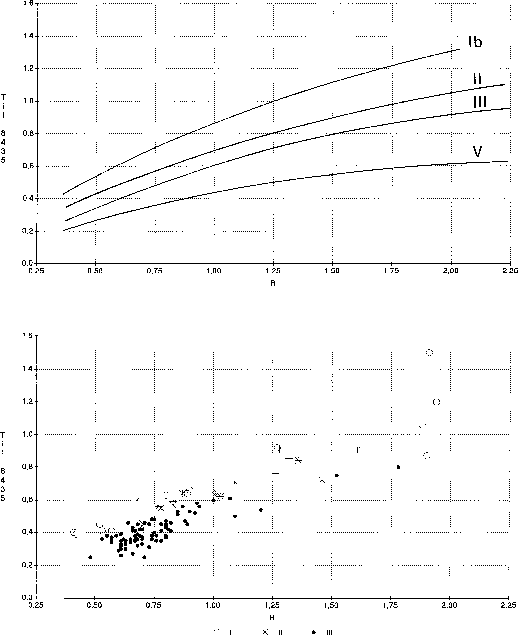
Figure 4: Equivalent width (in Å) of the TiI 8435 line versus R
(related with the spectral type) for the
MK standards (top) and for the composite spectra (bottom). ![]() :
giants; *: bright giants;
:
giants; *: bright giants; ![]() : supergiants
: supergiants
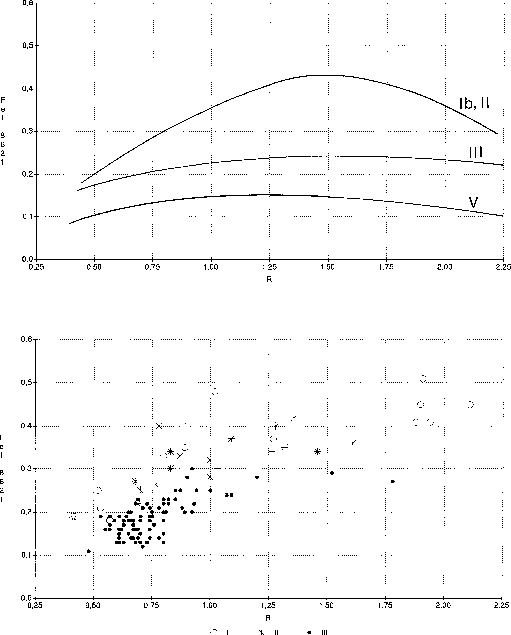
Figure 5: Equivalent width (in Å) of the FeI 8621 line versus R
(related with the spectral type) for the
MK standards (top) and for the composite spectra (bottom). ![]() :
giants; *: bright giants;
:
giants; *: bright giants; ![]() : supergiants
: supergiants
The first three columns provide the values of the simulated magnitude difference in the blue, the visual and the infrared (we assume that the primary is the cool component of the system).
![]() infinite corresponds to the spectrum of the primary alone.
The case labelled "real" corresponds
to the real case of HD 24554-5, with
infinite corresponds to the spectrum of the primary alone.
The case labelled "real" corresponds
to the real case of HD 24554-5, with ![]() . The values given
in the seven following columns
are the measured equivalent widths. The last two columns refer to the
absolute magnitude and the
luminosity class of the primary which follows from the assumed
. The values given
in the seven following columns
are the measured equivalent widths. The last two columns refer to the
absolute magnitude and the
luminosity class of the primary which follows from the assumed ![]() and the absolute magnitude of
the secondary.
and the absolute magnitude of
the secondary.
From an examination of the table it is easy to see that for magnitude
differences larger than -0.75 in
the blue (which corresponds to the majority of the composites), equivalent
widths change little
with the magnitude difference. This is specially remarkable for the sharp lines of FeI and TiI. For
the CaII lines the contribution of the Paschen lines, which increases when the magnitude difference
diminishes, compensates the flattening due to the influence of the hot spectrum. For the same
reason, the total absorption AT is practically invariable, even for ![]() . Also
for the ratio R one
can consider that within the errors of measurement, the ratio R and consequently the determination
of spectral type, is not influenced by the hot component.
. Also
for the ratio R one
can consider that within the errors of measurement, the ratio R and consequently the determination
of spectral type, is not influenced by the hot component.
We shall next provide some semi-theoretical considerations. Let us consider the most frequent case of composites of the type A5V + G, K III. If we assimilate each component to a black body, we can calculate at each wavelength the ratio between the intensities of both components. This was done in Table 5 (click here). For the absolute magnitude and intrinsic colors used we have taken the values given by Schmidt-Kaler (1982). Since these values are well established, the choice of this particular source is not critical.
If one fixes the threshold of the visibility of the companion at
![]() , an influence should be
noticeable when the ratio of the radiations of the two bodies is >0.16.
If one examines Table 5 (click here), one
perceives that in the case of a combination of AV + KIII, the lines of the
hot companion should not
be visible, although the contribution to the continuum is still of the
order of 0.06 to 0.13. In
consequence, the CaII lines should still be slightly flattened. In the
case of a combination AV +
GIII, the lines should only appear if the hot companion is of types A0-A2,
except for G0III but, as
shall be seen later on, early G type giants are missing among composites;
for the latter A types the
continuum of the giant is again influenced by that of the hotter star and
therefore the lines should
also be slightly flattened.
, an influence should be
noticeable when the ratio of the radiations of the two bodies is >0.16.
If one examines Table 5 (click here), one
perceives that in the case of a combination of AV + KIII, the lines of the
hot companion should not
be visible, although the contribution to the continuum is still of the
order of 0.06 to 0.13. In
consequence, the CaII lines should still be slightly flattened. In the
case of a combination AV +
GIII, the lines should only appear if the hot companion is of types A0-A2,
except for G0III but, as
shall be seen later on, early G type giants are missing among composites;
for the latter A types the
continuum of the giant is again influenced by that of the hotter star and
therefore the lines should
also be slightly flattened.
In the case of composites of types BV + G, K Ib the lines of the hot component should not be visible, but again one finds the contribution of the continuum to be of the order of 0.01 to 0.11, so that even in this case the lines should show some degree of flattening.
All this confirms what we have found during the classification work, namely that all lines of the cooler component of composites (even in the case of supergiants) suffer a diminution of their depth and appear thus artificially flattened.