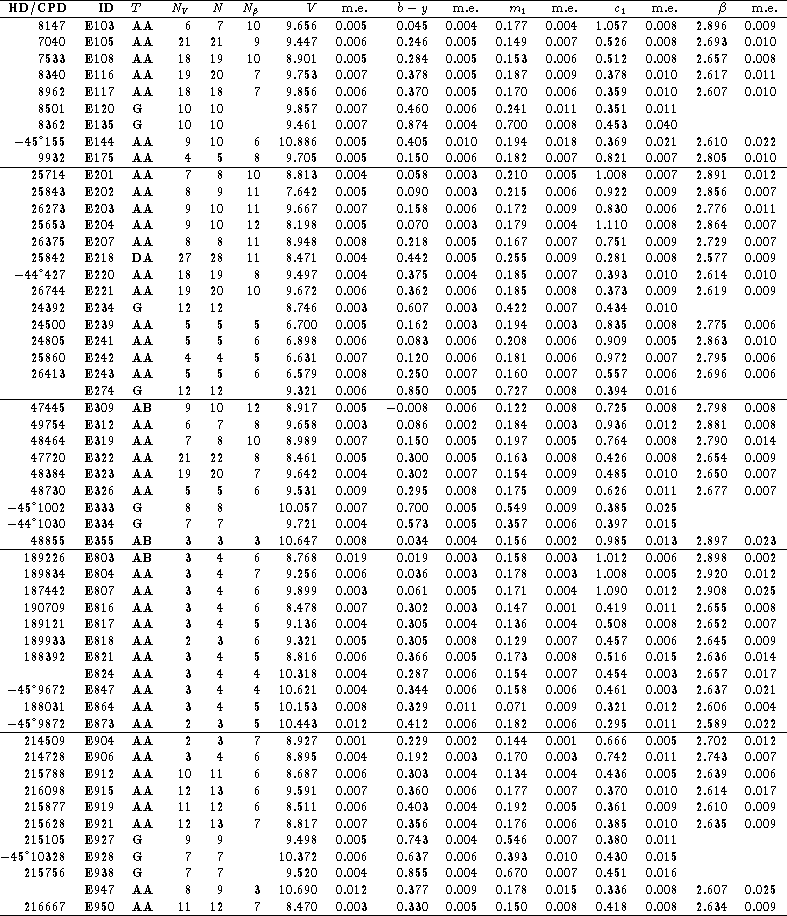
The transformed uvby and ![]() results for the program stars are
presented in Table 5 (click here). For each of these
potential secondary standards mean values of the indices are
given together with their rms errors and the total number of
observations. A few stars still have not quite enough
observations and/or their rms errors are slightly high; they are
easily identified from the information given in Table 5.
In Figs. 3 (click here)-7 (click here) the indices
given in Table 5 (click here) (with errors) have been compared with results
published in the lists from which the candidates were selected.
results for the program stars are
presented in Table 5 (click here). For each of these
potential secondary standards mean values of the indices are
given together with their rms errors and the total number of
observations. A few stars still have not quite enough
observations and/or their rms errors are slightly high; they are
easily identified from the information given in Table 5.
In Figs. 3 (click here)-7 (click here) the indices
given in Table 5 (click here) (with errors) have been compared with results
published in the lists from which the candidates were selected.
Of the 10 B stars selected from Knude (1992) 8 are shown in
Figs. 3 (click here) and 7 (click here). In average 8 observations per star have been obtained.
Small systematic differences are noticed; our b-y results
are typically slightly larger whereas ![]() and
and ![]() are typically
slightly lower than obtained by Knude (1992). The
b-y discrepancy might be partly removed if the adjustment described in
Sect. 4 (click here)
is applied on our data. For the two stars not shown in the
figures (HD 60993 = SAO 153144 and HD 68572 = SAO 198913) our
results disagree completely. Simbad information (mainly V)
support our results for HD 68572, which has probably been
misidentified by Knude. For HD 60993 the situation is less
obvious; note that the very low
are typically
slightly lower than obtained by Knude (1992). The
b-y discrepancy might be partly removed if the adjustment described in
Sect. 4 (click here)
is applied on our data. For the two stars not shown in the
figures (HD 60993 = SAO 153144 and HD 68572 = SAO 198913) our
results disagree completely. Simbad information (mainly V)
support our results for HD 68572, which has probably been
misidentified by Knude. For HD 60993 the situation is less
obvious; note that the very low ![]() value, indicating emission,
is outside the range covered by our primary standards.
value, indicating emission,
is outside the range covered by our primary standards.
Figure 4 (click here) shows a comparison with the uvby indices of Kilkenny &
Laing (1992) for 38 E-region stars, all belonging to the BAF
transformation category . Again our b-y results are generally
slightly larger and ![]() lower. If the adjustment of our b-y
results mentioned in Sect. 4 (click here) is added the discrepancy
becomes slightly larger in the 0.00 - 0.30 b-y interval and
remains nearly unchanged between 0.30 and 0.40. We have no reason
at all to suspect our
lower. If the adjustment of our b-y
results mentioned in Sect. 4 (click here) is added the discrepancy
becomes slightly larger in the 0.00 - 0.30 b-y interval and
remains nearly unchanged between 0.30 and 0.40. We have no reason
at all to suspect our ![]() results which are based on a large
number of primary standards (Table 2 (click here)) for which the standard
indices are nicely reproduced (Fig. 1 (click here)).
results which are based on a large
number of primary standards (Table 2 (click here)) for which the standard
indices are nicely reproduced (Fig. 1 (click here)).
In Figs. 5 (click here) and 7 (click here) our results are compared with those published by
Jønch-Sørensen (1993) for 31 E-region stars. 21 belong to
the BAF transformation region, and the comments given above to the
comparison with Kilkenny & Laing (1992) can basically be
repeated. With respect to ![]() our results are in average
slightly lower than obtained by Jønch-Sørensen (1993),
supporting the indication given in his paper that the
our results are in average
slightly lower than obtained by Jønch-Sørensen (1993),
supporting the indication given in his paper that the ![]() values
might be about 0.006 too high. The remaining 10 stars are G and
K giants, and here our
values
might be about 0.006 too high. The remaining 10 stars are G and
K giants, and here our ![]() results are typically 0.01 higher than
obtained by Jønch-Sørensen. Considering the rather small number
of primary standards available (we have used 8, Jønch-Sørensen
5) such differences are difficult to avoid and illustrate the
transformation problems for this category of stars. Again the
standard indices for the primary standard stars are, however,
nicely reproduced by our transformations (Fig. 1 (click here)).
results are typically 0.01 higher than
obtained by Jønch-Sørensen. Considering the rather small number
of primary standards available (we have used 8, Jønch-Sørensen
5) such differences are difficult to avoid and illustrate the
transformation problems for this category of stars. Again the
standard indices for the primary standard stars are, however,
nicely reproduced by our transformations (Fig. 1 (click here)).
Results for 9 G and K dwarfs are compared with those by Olsen
(1993, 1994a, 1994b) in Fig. 6 (click here).
HD 219057 is not shown in
the V panel (upper) since our V magnitude, which is based on 10 observations,
is significantly brighter than the average obtained by Olsen
(private communication);
Olsen (1993) gives V = 9.589 and Olsen (1994b) gives
V = 10.008, but both results have weight 0 in the catalogues.
The star HD 66020 which shows the largest discrepancy
in ![]() (Fig. 6 (click here), lower panel) lies slightly outside the
(Fig. 6 (click here), lower panel) lies slightly outside the ![]() interval
covered by the primary standards we have used. With these
comments two noticeable differences remain; our
interval
covered by the primary standards we have used. With these
comments two noticeable differences remain; our ![]() results are
systematically about 0.01 higher than obtained by Olsen, and our
results are
systematically about 0.01 higher than obtained by Olsen, and our ![]() results are typically about 0.01 lower. We have no clear explanation
in hand; in neither of the studies the transformed
results are typically about 0.01 lower. We have no clear explanation
in hand; in neither of the studies the transformed ![]() and
and ![]() indices of the primary standards deviate systematically
from their standard values (see Fig. 1 (click here)).
indices of the primary standards deviate systematically
from their standard values (see Fig. 1 (click here)).
Table 5: Catalogue of observed secondary standard stars. The ID column gives the
E-region identification (Cousins & Stoy 1962), T indicates
the uvby (A, D, G)
and ![]() (A, B) transformation
regions.
(A, B) transformation
regions. ![]() , N and
, N and ![]() indicate the number of observations in
V, uvby indices and
indicate the number of observations in
V, uvby indices and ![]() respectively; m.e. are the rms errors of one observation
respectively; m.e. are the rms errors of one observation
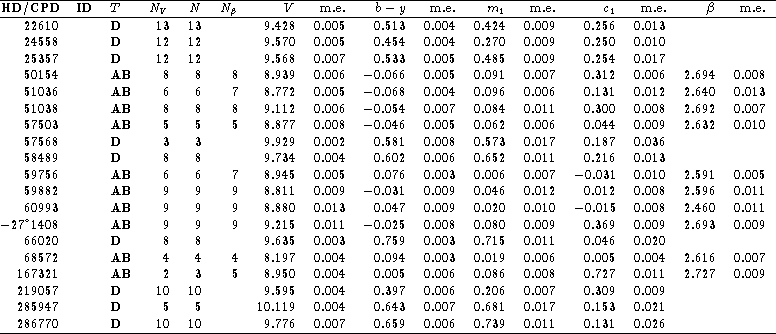
Table 5: continued