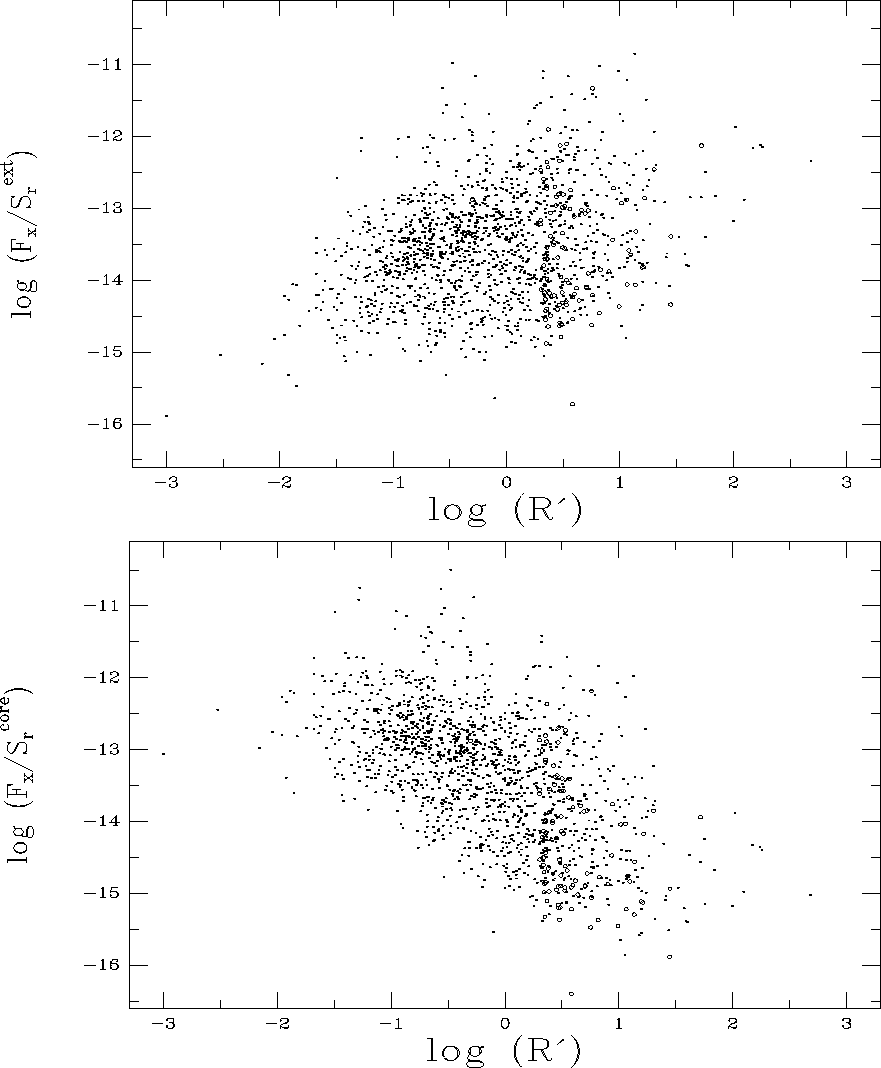
Figure 5: a) The ratio of X-ray to extended radio flux density as a
function of the radio core-to-lobe ratio, ![]() , for the RGB
sources. For those 118 sources for which the VLA core flux density was
greater than the Green Bank total flux density, we derive upper limits as
described in the text. These points are denoted by open circles in the
diagram. b) Similar to a) except the ordinate shows the ratio of
X-ray to core radio flux density
, for the RGB
sources. For those 118 sources for which the VLA core flux density was
greater than the Green Bank total flux density, we derive upper limits as
described in the text. These points are denoted by open circles in the
diagram. b) Similar to a) except the ordinate shows the ratio of
X-ray to core radio flux density
While the radio emission from radio-loud AGN consists of both beamed (core) and unbeamed (extended) components, the origin of the X-ray emission is not as clear. Only recently has the deconvolution of thermal (host galaxy) X-ray emission from nonthermal unresolved emission been possible (e.g. Worrall & Birkinshaw 1994). Although these studies are preliminary and the sample sizes small, it is reasonable to assume the X-ray fluxes for the RGB sample likely consist of a heterogeneous mix of these two components. General trends should nevertheless persist in the data revealing how much, if any, of the X-ray emission is beamed.
Because redshifts are not available for most of the objects in the RGB sample,
flux ratios must be used to compensate for distance effects. Specifically, we
compare the ratio of the X-ray flux (![]() , in
, in ![]() ) to the beamed radio core (
) to the beamed radio core (![]() in
mJy) and unbeamed extended (
in
mJy) and unbeamed extended (![]() ) components, with the
radio core-to-lobe ratio
) components, with the
radio core-to-lobe ratio ![]() (Fig. 5 (click here)). For those sources
where our VLA core measurement exceeded the GB total flux density measurement,
we derive limits (in both the ordinate and abscissa) by assuming the maximum
uncertainty in the radio flux densities, namely 20% error for sources
>20 mJy and 50% error otherwise. (See Sect. 3.2.) It is likely that the
uncertainty in the measurements and not source variability are to blame since
most of the sources which suffer from this effect are faint and therefore have
the greatest uncertainty in their measured flux densities. Nevertheless,
because there are so many sources where
(Fig. 5 (click here)). For those sources
where our VLA core measurement exceeded the GB total flux density measurement,
we derive limits (in both the ordinate and abscissa) by assuming the maximum
uncertainty in the radio flux densities, namely 20% error for sources
>20 mJy and 50% error otherwise. (See Sect. 3.2.) It is likely that the
uncertainty in the measurements and not source variability are to blame since
most of the sources which suffer from this effect are faint and therefore have
the greatest uncertainty in their measured flux densities. Nevertheless,
because there are so many sources where ![]() , the statistical significance of the following analyses
remains unchanged whether the upper limits are halved or doubled, thus insuring
our results are insensitive to our particular method for computing the limits.
, the statistical significance of the following analyses
remains unchanged whether the upper limits are halved or doubled, thus insuring
our results are insensitive to our particular method for computing the limits.
Figure 5 (click here)a shows the ratio of the total X-ray flux to extended radio
flux density (![]() ) versus
) versus
![]() while in Fig. 5 (click here)b we show the ratio of the total X-ray
flux to core radio flux density (
while in Fig. 5 (click here)b we show the ratio of the total X-ray
flux to core radio flux density (![]() ) versus
) versus
![]() . Two trends are seen in Fig. 5 (click here):
. Two trends are seen in Fig. 5 (click here): ![]() increases with increasing
increases with increasing ![]() , and
, and
![]() decreases with increasing
decreases with increasing
![]() . Both these trends are statistically significant at the
>99.99% level. Two possible biases could affect the correlations. First,
if the 83 sources for which no arcsecond-scale source was detected
(Table 7 (click here)) are real and not spurious detections in the 3
. Both these trends are statistically significant at the
>99.99% level. Two possible biases could affect the correlations. First,
if the 83 sources for which no arcsecond-scale source was detected
(Table 7 (click here)) are real and not spurious detections in the 3![]() Green Bank catalog, they must be lobe-dominated and would appear on the
left-hand side of Fig. 5 (click here)a. If these sources were also
systematically X-ray brighter so that they had high
Green Bank catalog, they must be lobe-dominated and would appear on the
left-hand side of Fig. 5 (click here)a. If these sources were also
systematically X-ray brighter so that they had high ![]() ratios then they could populate the upper left portion of
Fig. 5 (click here)a; however, the ROSAT fluxes for these sources span the same
range as the detected sources, indicating this potential bias is not
present. Second, the different flux limits of the original GB catalog
(
ratios then they could populate the upper left portion of
Fig. 5 (click here)a; however, the ROSAT fluxes for these sources span the same
range as the detected sources, indicating this potential bias is not
present. Second, the different flux limits of the original GB catalog
(![]() ) and the deeper VLA core measurements
(
) and the deeper VLA core measurements
(![]() ) imply core-dominated sources with
) imply core-dominated sources with ![]() are missing from the RGB catalog. These ``missing''
sources could destroy the correlation in Fig. 5 (click here)b only if their
core-to-lobe ratios exceeded
are missing from the RGB catalog. These ``missing''
sources could destroy the correlation in Fig. 5 (click here)b only if their
core-to-lobe ratios exceeded ![]() 10.0 and
10.0 and ![]() exceeded
exceeded ![]() . This is not the case, however, since our VLA
flux limit is only one order of magnitude deeper than the GB flux limit
thereby constraining the core-to-lobe ratios of the missing sources to be
. This is not the case, however, since our VLA
flux limit is only one order of magnitude deeper than the GB flux limit
thereby constraining the core-to-lobe ratios of the missing sources to be
![]() . We therefore conclude that the two trends in
Fig. 5 (click here) are real.
. We therefore conclude that the two trends in
Fig. 5 (click here) are real.
To understand these relationships, we characterize the X-ray emission by an
X-ray ``core-to-extended'' ratio, ![]() , defined by:
, defined by:
![]()
If the X-ray core beaming is simply related to the radio core beaming, we can
write ![]() where k is a constant.
The quantities plotted in Fig. 5 (click here) are then:
where k is a constant.
The quantities plotted in Fig. 5 (click here) are then:
![]()
and
![]()
First we consider the case where the X-ray emission is isotropic so that
![]() and k=0. Then as the angle to the
line-of-sight decreases, both
and k=0. Then as the angle to the
line-of-sight decreases, both ![]() and
and ![]() increase but
increase but ![]() remains constant. The ratio of
remains constant. The ratio of
![]() would therefore be anticorrelated with
would therefore be anticorrelated with
![]() as seen in Fig. 5 (click here)b. However, the ratio of
as seen in Fig. 5 (click here)b. However, the ratio of ![]() would be uncorrelated with
would be uncorrelated with ![]() since neither parameter would vary with orientation. The positive correlation
in Fig. 5 (click here)a, therefore rules out the possibility that X-ray emission
for sources in the RGB catalog is entirely isotropic.
since neither parameter would vary with orientation. The positive correlation
in Fig. 5 (click here)a, therefore rules out the possibility that X-ray emission
for sources in the RGB catalog is entirely isotropic.
If we now consider the other extreme where the X-ray emission consists of a much
higher fraction of beamed radiation than the radio emission (k>>1).
![]() should then be correlated with
should then be correlated with
![]() , as observed, but the ratio of
, as observed, but the ratio of ![]() would become uncorrelated with
would become uncorrelated with ![]() at even modest
values of
at even modest
values of ![]() , which is clearly not seen (Fig. 5 (click here)b).
Therefore, if the X-ray emission is beamed, it is not characterized by a
high k-value. As an alternative to the models presented in Eqs. (6-8),
we consider the case where
, which is clearly not seen (Fig. 5 (click here)b).
Therefore, if the X-ray emission is beamed, it is not characterized by a
high k-value. As an alternative to the models presented in Eqs. (6-8),
we consider the case where ![]() . Such a
scenario has been proposed in terms of an accelerating jet model for BL Lac
objects (e.g. Ghisellini & Maraschi 1989) where
. Such a
scenario has been proposed in terms of an accelerating jet model for BL Lac
objects (e.g. Ghisellini & Maraschi 1989) where
![]() . We find that in order to produce the
relations seen in Fig. 5 (click here) which are valid over three orders of
magnitude in the X-ray to radio flux ratios and five orders of magnitude in
. We find that in order to produce the
relations seen in Fig. 5 (click here) which are valid over three orders of
magnitude in the X-ray to radio flux ratios and five orders of magnitude in
![]() ,
, ![]() and
and ![]() , which is
consistent with bulk velocities inferred through other means (e.g.
Urry & Padovani 1995).
, which is
consistent with bulk velocities inferred through other means (e.g.
Urry & Padovani 1995).
Figures 5 (click here)a and 5 (click here)b therefore indicate the X-ray emission
of the RGB sample is neither entirely isotropic (![]() ) nor
characterized by a high k-value. However, the scatter in the diagrams is
large enough to prevent an accurate measurement of the fraction of beamed
X-rays or even to distinguish beamed X-ray emission from unbeamed but
anisotropic emission. The latter could arise, for example, from a
population of objects with an obscuring torus with varying column density
which blocks more soft X-rays as the torus becomes more edge-on to the
line-of-sight.
) nor
characterized by a high k-value. However, the scatter in the diagrams is
large enough to prevent an accurate measurement of the fraction of beamed
X-rays or even to distinguish beamed X-ray emission from unbeamed but
anisotropic emission. The latter could arise, for example, from a
population of objects with an obscuring torus with varying column density
which blocks more soft X-rays as the torus becomes more edge-on to the
line-of-sight.
The large scatter in the diagrams is primarily due to the heterogeneity of the RGB sample, which includes radio galaxies, quasars and BL Lacs. Examination of a single class of AGN, such as RGB BL Lacs, can yield more quantitative results (Laurent-Muehleisen et al., in preparation).