In Sect. 2 we have shown that if the
potential is not too far from the central symmetry, we can derive the global
orbital structure by means of an additional pseudo-invariant.
With this model we cannot describe chaotic zones
(like the stochastic layer that separates box and loop families)
and secondary resonances (like the banana sub-family).
Hence to get information about the fine structure of the phase space
as well as to measure chaos in the irregular components we
should follow some other approach. As we pointed out in Sect. 1
the LCN provides a good measure of chaos but it does not
furnish any information about the structure of the regular component.
This fact is a consequence of the definition of the LCN,
![]() ,
for a given orbit,
,
for a given orbit, ![]() ,
on a compact energy surface,
,
on a compact energy surface, ![]() ,
,
In practice, instead of the infinite limit one computes
![]() for T "large enough'', for instance, 104 characteristic periods. For any
regular orbit,
for T "large enough'', for instance, 104 characteristic periods. For any
regular orbit,
![]() - see
below - and then
- see
below - and then
![]() ,
almost independent of
,
almost independent of
![]() .
However some departures from the latter value exist depending whether
the orbit is periodic stable or it is stable quasiperiodic but passing close to
an unstable periodic orbit.
.
However some departures from the latter value exist depending whether
the orbit is periodic stable or it is stable quasiperiodic but passing close to
an unstable periodic orbit.
As an example let us consider a neighbourhood, U, of an unstable periodic
orbit
![]() .
The motion in U is mainly determined by the stable and
unstable manifolds associated to
.
The motion in U is mainly determined by the stable and
unstable manifolds associated to
![]() .
Therefore any quasiperiodic orbit,
.
Therefore any quasiperiodic orbit,
![]() ,
that falls in U will mimic, for a short time interval,
,
that falls in U will mimic, for a short time interval,
![]() .
Since for the latter
.
Since for the latter
![]() grows exponentially with
time, then
grows exponentially with
time, then
![]() will behave in a similar manner while
will behave in a similar manner while
![]() lies in U. This will happen periodically, each time
lies in U. This will happen periodically, each time
![]() enters in U. Therefore if we look at the time evolution of
enters in U. Therefore if we look at the time evolution of
![]() we should see a
we should see a ![]() law modulated by a periodic
peak structure (besides the purely quasiperiodic oscillations). Anyway the final
value of
law modulated by a periodic
peak structure (besides the purely quasiperiodic oscillations). Anyway the final
value of
![]() for t=T will be very close to
for t=T will be very close to ![]() ,
except (perhaps) if we stop the computation just when
,
except (perhaps) if we stop the computation just when
![]() is in U.
The only way to put in evidence the latter behaviour is to take into account
somehow the time evolution of
is in U.
The only way to put in evidence the latter behaviour is to take into account
somehow the time evolution of
![]() .
A simple way to do that and
to amplify the effect of unstable periodic orbits on quasiperiodic motion is
the following.
.
A simple way to do that and
to amplify the effect of unstable periodic orbits on quasiperiodic motion is
the following.
The definition of the LCN, given by (21), can be written in an
integral form as

As we note from (23),
![]() determines how fast
determines how fast
![]() .
Since
.
Since ![]() is a measure of the lack of
isochronicity around
is a measure of the lack of
isochronicity around ![]() (to be precise,
(to be precise, ![]() is the largest
eigenvalue of the matrix
is the largest
eigenvalue of the matrix
![]() ,
being
,
being ![]() the action), we see that the smaller
the action), we see that the smaller ![]() appears for
appears for ![]() in a
neighbourhood of a stable periodic orbit. Therefore we expect a slower rate of
convergence of
in a
neighbourhood of a stable periodic orbit. Therefore we expect a slower rate of
convergence of
![]() to 2 for
to 2 for
![]() close to a stable "elliptic''
periodic orbit. On the other hand, from the discussion given above about the
behaviour of quasiperiodic orbits close to unstable periodic ones, we expect
that in this case
close to a stable "elliptic''
periodic orbit. On the other hand, from the discussion given above about the
behaviour of quasiperiodic orbits close to unstable periodic ones, we expect
that in this case
![]() presents quasiperiodic oscillations,
given by
presents quasiperiodic oscillations,
given by
![]() ,
as well as a peak structure.
Therefore for arbitrary
,
as well as a peak structure.
Therefore for arbitrary
![]() ,
the formal limit,
,
the formal limit,
![]() ,
does not exist (see below).
,
does not exist (see below).
For any irregular orbit,
![]() ,
for which
,
for which ![]() grows exponentially
with time, we get
grows exponentially
with time, we get
While ![]() has not a formal limit,
has not a formal limit,
![]() and the mean values
and the mean values
![]() have an asymptotic law for
have an asymptotic law for
![]()
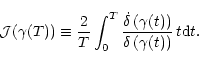
Of most importance is that
![]() can be written in an unique way
for both types of motion,
can be written in an unique way
for both types of motion,
![]() with a=0, b=2 for
regular, quasiperiodic motion and
with a=0, b=2 for
regular, quasiperiodic motion and ![]() ,
,
![]() for irregular one. If
for irregular one. If
![]() grows with some power of t, say n, as it could happen in
some degenerated cases, a=0, b=2n. Only when the phase space has a
hyperbolic structure, where nearby orbits diverge exponentially with time,
grows with some power of t, say n, as it could happen in
some degenerated cases, a=0, b=2n. Only when the phase space has a
hyperbolic structure, where nearby orbits diverge exponentially with time,
![]() and the MEGNO grows with time. This occurs for irregular, chaotic
motion and also, for instance, for unstable periodic orbits (see Giorgilli
et al. 1997, for a visualization of the hyperbolic structure of chaotic zones).
and the MEGNO grows with time. This occurs for irregular, chaotic
motion and also, for instance, for unstable periodic orbits (see Giorgilli
et al. 1997, for a visualization of the hyperbolic structure of chaotic zones).
From (25) it turns out that if we have
![]() for any T we
can recover the LCN by a linear least squares fit. The main advantage of this
approach is that we use the dynamical information contained in
for any T we
can recover the LCN by a linear least squares fit. The main advantage of this
approach is that we use the dynamical information contained in
![]() along the whole time interval. Hence, we expect that this procedure will provide
a good estimation of the LCN in both regular and irregular domains. Furthermore
a least squares fit will also give us information about the
location of hyperbolic orbits, the very origin of chaos. Therefore
the derivation of the LCN from the MEGNO
seems to be useful not only to get the global dynamics
but to learn some details concerning the fine structure of phase space
as well.
A more complete discussion about the MEGNO technique
as well as some examples of application to
3D systems are given in Cincotta et al. (2000).
along the whole time interval. Hence, we expect that this procedure will provide
a good estimation of the LCN in both regular and irregular domains. Furthermore
a least squares fit will also give us information about the
location of hyperbolic orbits, the very origin of chaos. Therefore
the derivation of the LCN from the MEGNO
seems to be useful not only to get the global dynamics
but to learn some details concerning the fine structure of phase space
as well.
A more complete discussion about the MEGNO technique
as well as some examples of application to
3D systems are given in Cincotta et al. (2000).
| |
Figure 7:
Time evolution of
|
To investigate numerically this technique we considered again the logarithmic
potential defined in (15), or its associated Hamiltonian (16),
for the same parameters, energy level, ![]() ,
and q values taken in Sect. 2.2.
We use the initial values x0, px0 to parameterize loop and box
orbits respectively (see Sect. 2.2 and below).
,
and q values taken in Sect. 2.2.
We use the initial values x0, px0 to parameterize loop and box
orbits respectively (see Sect. 2.2 and below).
The computation of ![]() was done using (22) for a given set
of initial conditions.
All the integrations were carried out for a
realistic time scale,
was done using (22) for a given set
of initial conditions.
All the integrations were carried out for a
realistic time scale,
![]() where
where ![]() is the period of
the long-axis periodic orbit. Therefore the computational effort per unit
time is almost the same needed to compute the LCN but comparatively
shorter motion times are required. The renormalization of
is the period of
the long-axis periodic orbit. Therefore the computational effort per unit
time is almost the same needed to compute the LCN but comparatively
shorter motion times are required. The renormalization of
![]() (if
necessary), proceeds naturally from (22).
(if
necessary), proceeds naturally from (22).
To solve the variational equations we took
![]() along the x axis
for loops and along the px axis for boxes with
along the x axis
for loops and along the px axis for boxes with
![]() and
random sign. We used a Runge-Kutta 7/8 th order integrator (the so-called
DOPRI8 routine, see
Prince & Dormand 1981;
Hairer et al. 1987).
The accuracy in the preservation of the value of the energy is
and
random sign. We used a Runge-Kutta 7/8 th order integrator (the so-called
DOPRI8 routine, see
Prince & Dormand 1981;
Hairer et al. 1987).
The accuracy in the preservation of the value of the energy is
![]() .
.
To eliminate fast quasiperiodic oscillations, that is, to compute
![]() ,
we averaged
,
we averaged
![]() as follows
as follows
To perform the least squares fit to get the slope of
![]() ,
that is the
LCN, we use the values of
,
that is the
LCN, we use the values of
![]() along the last 85% of the time
interval (
along the last 85% of the time
interval (
![]() ), just to avoid the initial transient. We add a
factor 2 in the derived slope to compensate the average introduced in
), just to avoid the initial transient. We add a
factor 2 in the derived slope to compensate the average introduced in
![]() .
Indeed, since for an irregular orbit
.
Indeed, since for an irregular orbit ![]() grows nearly linear,
the slope derived from
grows nearly linear,
the slope derived from
![]() would be underestimated in a factor 2.
would be underestimated in a factor 2.
In Fig. 7 we show the time evolution of
![]() for three
representative orbits. The regular ones
belong to the loop family while the irregular one to the stochastic layer. For
the latter we plot
for three
representative orbits. The regular ones
belong to the loop family while the irregular one to the stochastic layer. For
the latter we plot ![]() together with
together with
![]() to put in evidence
that the factor 2 introduced ad hoc is necessary. The figure on the left
corresponds to two regular orbits, A and B. Orbit A, stable quasiperiodic,
saturates very fast from below to 2, without any significant oscillation.
Orbit B, also stable quasiperiodic, comes very close to an unstable periodic orbit.
We observe the influence of the unstable periodic orbit on B leading to several
local maxima of decreasing amplitude. This behaviour of the amplitude of the
maxima is due to the average of
to put in evidence
that the factor 2 introduced ad hoc is necessary. The figure on the left
corresponds to two regular orbits, A and B. Orbit A, stable quasiperiodic,
saturates very fast from below to 2, without any significant oscillation.
Orbit B, also stable quasiperiodic, comes very close to an unstable periodic orbit.
We observe the influence of the unstable periodic orbit on B leading to several
local maxima of decreasing amplitude. This behaviour of the amplitude of the
maxima is due to the average of ![]() (see Eq. (26)) and
it should decrease as
(see Eq. (26)) and
it should decrease as ![]() .
Note that in this case
.
Note that in this case
![]() takes higher values. This is also due to
the presence of a nearby hyperbolic orbit. For the irregular orbit, C, (on the
right figure) we see a nearly linear behaviour. In fact,
takes higher values. This is also due to
the presence of a nearby hyperbolic orbit. For the irregular orbit, C, (on the
right figure) we see a nearly linear behaviour. In fact,
![]() looks smoother and follows the same linear trend than
looks smoother and follows the same linear trend than
![]() .
.
In Fig. 8 we plot the time evolution of
![]() and
and ![]() for orbits A and C. For the regular orbit A,
for orbits A and C. For the regular orbit A,
![]() .
The theoretical values (in logarithmic scale)
are -3.18 and -2.57 respectively (see Eq. (25) and around),
which are in good agreement with the computed ones.
For the irregular orbit C, we see that
.
The theoretical values (in logarithmic scale)
are -3.18 and -2.57 respectively (see Eq. (25) and around),
which are in good agreement with the computed ones.
For the irregular orbit C, we see that
![]() ,
also consistent with the above discussion.
,
also consistent with the above discussion.
![\begin{figure}
\par\includegraphics[width=60mm,angle=-90]{H1686f14.ps}\end{figure}](/articles/aas/full/2000/20/h1686/img344.gif) |
Figure 8:
Time evolution of
|
Since the relative error in the estimation of the positive LCN after
a motion time T is
![]() ,
where
,
where
![]() is the Lyapunov time,
we see that
is the Lyapunov time,
we see that
![]() is not enough to separate a chaotic region with
is not enough to separate a chaotic region with
![]() from the regular one. This is one of the reasons of why it is
necessary to take very long motion times to compute the LCN using the standard
method. It is important to remark that in this particular application it is
enough to obtain an estimation of the order of magnitude of
from the regular one. This is one of the reasons of why it is
necessary to take very long motion times to compute the LCN using the standard
method. It is important to remark that in this particular application it is
enough to obtain an estimation of the order of magnitude of ![]() .
When an
accurate determination of the LCN is necessary, the motion time could be
very large. The presence of small resonance domains embedded in a chaotic sea
produces the so-called stickiness that reduces the free diffusion. So the
motion time needed in this case to compute the positive LCN should be large
enough so that the orbit could fill almost all the available subset of the
energy surface.
.
When an
accurate determination of the LCN is necessary, the motion time could be
very large. The presence of small resonance domains embedded in a chaotic sea
produces the so-called stickiness that reduces the free diffusion. So the
motion time needed in this case to compute the positive LCN should be large
enough so that the orbit could fill almost all the available subset of the
energy surface.
In Fig. 9 we show in the same plot ![]() and
and
![]() for
for
![]() and
and ![]() (q=0.9, 0.8 and 0.7). First of all we note that in any
case
(q=0.9, 0.8 and 0.7). First of all we note that in any
case ![]() and
and
![]() agree in the gross stochastic layer.
The same happens, for q=0.7, in the thin stochastic layer around the
x-axis periodic orbit as well as in some narrow chaotic zones around
other resonances. But the value of
agree in the gross stochastic layer.
The same happens, for q=0.7, in the thin stochastic layer around the
x-axis periodic orbit as well as in some narrow chaotic zones around
other resonances. But the value of ![]() over all regular regions
is nearly the same,
over all regular regions
is nearly the same,
![]() .
Just a few zones, where
.
Just a few zones, where ![]() appears to behave in a smoother way, could be
supposed to be the signature of an island. In contrast,
appears to behave in a smoother way, could be
supposed to be the signature of an island. In contrast,
![]() clearly
shows the underlying structure of the regular region. Note that
clearly
shows the underlying structure of the regular region. Note that
![]() leads to a Lyapunov time for the regular component of
leads to a Lyapunov time for the regular component of
![]() in
in
![]() while
while ![]() leads to
leads to
![]() .
To get such long values of
.
To get such long values of
![]() (in the regular domain) by means of the computation of
(in the regular domain) by means of the computation of ![]() ,
the total motion time should be
,
the total motion time should be
![]() .
.
Globally we see that, for ![]() (Fig. 9 - left column), the domain is clearly
divided in two zones. One near to the unstable short-axis orbit (at the
origin), that contains irregular orbits and many small sub-families
corresponding to each small resonance domain (see below). The other zone, near
to the 1:1 periodic orbit, looks free of resonances and completely populated by
quasiperiodic loop orbits. Note that
(Fig. 9 - left column), the domain is clearly
divided in two zones. One near to the unstable short-axis orbit (at the
origin), that contains irregular orbits and many small sub-families
corresponding to each small resonance domain (see below). The other zone, near
to the 1:1 periodic orbit, looks free of resonances and completely populated by
quasiperiodic loop orbits. Note that
![]() increases slowly as we
approach to the 1:1 orbit. This is a consequence of the fact that the rate of
convergence of
increases slowly as we
approach to the 1:1 orbit. This is a consequence of the fact that the rate of
convergence of ![]() to 2 is the slower for orbits near
to the latter "elliptic'' periodic orbit (see Sect. 4.1).
to 2 is the slower for orbits near
to the latter "elliptic'' periodic orbit (see Sect. 4.1).
![\begin{figure}
\begin{center}
{$(x,\,p_x)$\space section for loops -- $\bar{{\ca...
...raphics[width=50mm,height=90mm,angle=-90]{H1686f25.ps}$^{{\rm (b)}}$\end{figure}](/articles/aas/full/2000/20/h1686/img369.gif) |
Figure 11:
a) Section y=0 for loops close to the border of the stochastic
layer, window:
|
For ![]() (right column) the scenario is different. The fraction of irregular
orbits is larger (specially for q not too far from 1) and we can appreciate
many resonances along the whole domain, even for q=0.9. For the largest
perturbation, q=0.7, one could infer that quasiperiodic box orbits do exist
but, in some sense, discontinuously and the region occupied by other
sub-families (boxlets) is almost as large as that filled by purely box orbits.
Recall that the banana sub-family is not included here because all that orbits
cross the surface y=0 near the boundary of the section with
(right column) the scenario is different. The fraction of irregular
orbits is larger (specially for q not too far from 1) and we can appreciate
many resonances along the whole domain, even for q=0.9. For the largest
perturbation, q=0.7, one could infer that quasiperiodic box orbits do exist
but, in some sense, discontinuously and the region occupied by other
sub-families (boxlets) is almost as large as that filled by purely box orbits.
Recall that the banana sub-family is not included here because all that orbits
cross the surface y=0 near the boundary of the section with ![]() (this
follows immediately from Fig. 1; see also Fig. 15). As a
difference with
(this
follows immediately from Fig. 1; see also Fig. 15). As a
difference with ![]() ,
,
![]() decreases slowly as we approach to the
long-axis periodic orbit. This behaviour is purely due to the choice of
variables, since if instead of (x,px) we had used (y,py), this orbit
would appeared as an elliptic point. This effect is a consequence of the
projection of the motion onto a 2D plane while, if we project it onto the
"natural'' space, which is the 2D sphere, this problem does not appear.
decreases slowly as we approach to the
long-axis periodic orbit. This behaviour is purely due to the choice of
variables, since if instead of (x,px) we had used (y,py), this orbit
would appeared as an elliptic point. This effect is a consequence of the
projection of the motion onto a 2D plane while, if we project it onto the
"natural'' space, which is the 2D sphere, this problem does not appear.
In Fig. 10 we plot the resonance zone for loops close to the
stochastic layer. We marked by an arrow the most significant resonances. Those
labeled by "r'' were also detected by PL96 by means of the frequency map
analysis (FMA) and therefore we have at hand the rotation number corresponding
to these resonances (see Sect. 6). It is important to mention that
the resolution in x0 is similar to that of PL96 but the motion time used
here is larger, about a factor 10 (
![]() and
and
![]() ,
respectively). Yet,
Fig. 7 shows that shorter motion times, about
,
respectively). Yet,
Fig. 7 shows that shorter motion times, about
![]() ,
would be enough.
Note that, in any case, this technique is able to put in evidence the complex
structure of resonances in the neighbourhood of the stochastic layer. We
distinguish basically two different types of departures from quasiperiodic
motion, peaks and valleys. From the discussion given
in Sect. 4.1 we easily conclude that the peaks correspond to unstable
periodic orbits and to quasiperiodic orbits in a neighbourhood of the latter.
The valleys appear when some orbits are locked inside a resonance. For example,
looking at Fig. 10 for q=0.7 we observe a single peak very
close to x0=0.06 and, for
,
would be enough.
Note that, in any case, this technique is able to put in evidence the complex
structure of resonances in the neighbourhood of the stochastic layer. We
distinguish basically two different types of departures from quasiperiodic
motion, peaks and valleys. From the discussion given
in Sect. 4.1 we easily conclude that the peaks correspond to unstable
periodic orbits and to quasiperiodic orbits in a neighbourhood of the latter.
The valleys appear when some orbits are locked inside a resonance. For example,
looking at Fig. 10 for q=0.7 we observe a single peak very
close to x0=0.06 and, for
![]() ,
we see two peaks
at both sides of a valley. In the first case the peak is due to the fact that we
are crossing an island chain through the hyperbolic point, the orbits never fall
inside the resonance. On the other hand, when we cross the island chain through
the center of one island, i.e. through the elliptic point, we intersect twice
the separatrix and some orbits are trapped by the resonance.
The width of a
peak or a valley is then a measure of the actual size of the resonance.
,
we see two peaks
at both sides of a valley. In the first case the peak is due to the fact that we
are crossing an island chain through the hyperbolic point, the orbits never fall
inside the resonance. On the other hand, when we cross the island chain through
the center of one island, i.e. through the elliptic point, we intersect twice
the separatrix and some orbits are trapped by the resonance.
The width of a
peak or a valley is then a measure of the actual size of the resonance.
This can be visualized also from Fig. 11a where we plot a
high-resolution surface of section for loops in the neighbourhood
of the unstable periodic orbit at
![]() (4:9 resonance, see
Sect. 6). The arrows in this figure indicate some of the resonances
observed in the corresponding Fig. 10. In the latter figure, for
(4:9 resonance, see
Sect. 6). The arrows in this figure indicate some of the resonances
observed in the corresponding Fig. 10. In the latter figure, for
![]() we have marked two small peaks that should
correspond to unstable periodic orbits but in Fig. 11a their presence
is not evident. Nevertheless for
we have marked two small peaks that should
correspond to unstable periodic orbits but in Fig. 11a their presence
is not evident. Nevertheless for
![]() one can distinguish a
rather narrow resonance that should be responsible of one of the mentioned peaks
(in fact, to that located more distant to the 4:9 resonance). A similar picture
to that given by
one can distinguish a
rather narrow resonance that should be responsible of one of the mentioned peaks
(in fact, to that located more distant to the 4:9 resonance). A similar picture
to that given by
![]() comes from
comes from
![]() where Fig. 11b
is representative to illustrate the MEGNO's behaviour.
Here we plot the final value of
where Fig. 11b
is representative to illustrate the MEGNO's behaviour.
Here we plot the final value of
![]() for
the same window shown in Fig. 11a and only for
for
the same window shown in Fig. 11a and only for ![]() orbits with
the same resolution in x0 like that in Figs. 9 and 10.
Along this interval
orbits with
the same resolution in x0 like that in Figs. 9 and 10.
Along this interval
![]() is
very close to 2 but we can appreciate the resonances observed in the
surface of section as well as those marked in Fig. 10.
In any case
is
very close to 2 but we can appreciate the resonances observed in the
surface of section as well as those marked in Fig. 10.
In any case
![]() and the dotted line corresponds to the
theoretical value for stable quasiperiodic motion,
and the dotted line corresponds to the
theoretical value for stable quasiperiodic motion,
![]() .
.
Figure 10 as well as Fig. 12, where we plot the full domain
of box family in separated windows (but with the same resolution in px0than in Fig. 9), are very illustrative to see how resonances in the
neighbourhood of the stochastic layer
overlap as the perturbation increases,
leading to an enlargement of the layer and therefore to a larger domain of
irregular motion. A few small and not too small islands are embedded in this
chaotic zone, some of them are indicated in both figures. All the thin peaks
observed in both figures correspond to hyperbolic orbits. Therefore we obtain a
picture of the hyperbolic structure of the phase space that announces the future
appearance of irregular motion as soon as we increase the perturbation (to be
precise, irregular motion certainly exists around all these resonances but it is
confined to a set of negligible measure). Additionally
![]() reveals
some details about the internal structure of the secondary resonances.
reveals
some details about the internal structure of the secondary resonances.
Copyright The European Southern Observatory (ESO)


![\begin{figure}
\begin{center}
{$\sigma\rightarrow{\rm LCN1}\quad\sigma_{\rm ls}\...
...graphics[width=44mm,height=89mm,angle=-90]{H1686f20.ps}\end{tabular}\end{figure}](/articles/aas/full/2000/20/h1686/img352.gif)
![\begin{figure}
{$\sigma_{\rm ls}$\space -- Resonances in loop domain}\\
{\tiny$...
...
{\includegraphics[width=44mm,height=85mm,angle=-90]{H1686f23.ps} }
\end{figure}](/articles/aas/full/2000/20/h1686/img367.gif)
![\begin{figure}
\begin{center}
{$\sigma_{\rm ls}$\space -- Resonances in box doma...
...graphics[width=44mm,height=89mm,angle=-90]{H1686f31.ps}\end{tabular}\end{figure}](/articles/aas/full/2000/20/h1686/img371.gif)