

Up: Combined smoothing method and
Subsections
In general, two time series of observations are available - one
with measured function values of a certain quantity whose analytic
expression is unknown (Series 1) and the other with measured time
derivatives of the same quantity (Series 2). Both series are given
at unequally spaced epochs that need not be necessarily identical,
and the individual observations are given with different
precision, defined by their formal uncertainties (that can be
easily converted into weights). We further assume that both series
are independent one from the other, and also that the individual
observations of the same series are de-correlated. The situation
is illustrated in Fig. 1, where the upper plot shows
the observed function values and their uncertainties (Series 1),
the lower plot depicts Series 2 with the observed values of the
first derivatives with their uncertainties.
![\begin{figure}
\par\includegraphics[width=8.8cm,clip]{jv9736f1.eps} \end{figure}](/articles/aas/full/2000/20/ds9736/Timg11.gif) |
Figure 1:
Illustration of combined smoothing. Full circles and
vertical lines represent the observations and their uncertainties,
full lines the smoothed curves (top - function values, bottom -
first derivatives) |
Full lines in both
plots represent the smoothed values; the lower one is the first
derivative of the upper one.
We are looking for a unique time series defined at all points with
observations (no matter whether belonging to Series 1 or 2), lying
on a sufficiently smooth curve, whose function values fit well to
the values of Series 1 and whose time derivative fits well to the
values of Series 2. Let
- input Series 1 be given as the observed function values yj'at instants xj with weights pj,
 ;
;
- input Series 2 as the observed values of first derivatives
 at instants
  with weights
  ,
,
 ;
;
- output series of the searched function values on the
smoothed curve be yi at the instants xi containing all
values of xj and ,
 ,
where
,
where
 .
.
In further considerations we shall assume that both input series
are defined at all N points xi, and that the respective
weights at the points with no observations are equal to zero.
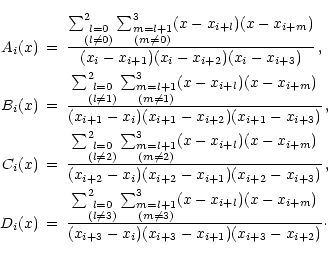
We define three quantities:
- 1.
- Smoothness of the curve (identical with the definition of the original
smoothing):
Analytical expression of the function
 is unknown so
the value of its third derivative
is unknown so
the value of its third derivative
 must be
estimated numerically from the smoothed data y. The smoothed
curve in the interval between two points
[xi+1; yi+1] and
[xi+2; yi+2] is defined as a third-order Lagrange
polynomial Li(x) running through the four adjacent points i,
i+1, i+2, i+3, i.e.
must be
estimated numerically from the smoothed data y. The smoothed
curve in the interval between two points
[xi+1; yi+1] and
[xi+2; yi+2] is defined as a third-order Lagrange
polynomial Li(x) running through the four adjacent points i,
i+1, i+2, i+3, i.e.
Its third derivative is then equal to
The third derivatives between each pair of points are given as
constants, thus the integral is replaced by a summation:
|
S |
= |
 |
(1) |
| |
= |
 |
|
where
This definition of the smoothness implies that the ideally smooth
function (i.e., the one for which S=0) is a quadratic function
(and, consequently, its first derivative a linear function) of
time. Therefore, the combined estimator proposed in the present
paper is different from the original smoothing applied directly to
the observed derivatives alone;
- 2.
- Fidelity of the smoothed curve to the observed values
(almost identical with the definition of the original smoothing):
 |
(2) |
- 3.
- Fidelity of the smoothed curve to the observed first
derivatives (new):
 |
(3) |
in which the smoothed values of first derivatives  can
be expressed in terms of the smoothed function values yi.
can
be expressed in terms of the smoothed function values yi.
Using the first derivatives of the same Lagrange polynomials
Li(x) that are used to define S we can express L'i(x), for
x lying anywhere in the interval limited by the four adjacent
points i, i+1, i+2, i+3, as
in which
To express the smoothed values of first derivatives
in
Eq. (3) in terms of the smoothed function values
yi, we have a certain freedom of choice of the four points
surrounding each of the epochs xi. We adopt, for the sake of
time symmetry, the approach leading to exactly the same solution
if the time axis is reversed; the following equations formulate
the constraints assuring that the values
lie on the
curve that is the time derivative of the one represented by yi:
- 1.
- For calculating
 ,
we use the epochs x1,
x2, x3, x4; it means that we have
,
we use the epochs x1,
x2, x3, x4; it means that we have
- 2.
- For calculating
in the first half of the series,
i.e. for
 ,
we use the epochs xi-1,
xi, xi+1, xi+2; it means that we have
,
we use the epochs xi-1,
xi, xi+1, xi+2; it means that we have
- 3.
- For calculating
in the second half of the series,
i.e. for
 ,
we use the epochs xi-2,
xi-1, xi, xi+1; it means that we have
,
we use the epochs xi-2,
xi-1, xi, xi+1; it means that we have
- 4.
- For calculating
 ,
we use the epochs xN-3,
xN-2, xN-1, xN; it means that we have
,
we use the epochs xN-3,
xN-2, xN-1, xN; it means that we have
The expression (3) then can be rewritten as
We are looking for the smoothed values yi (and the first
derivatives
corresponding to them) as a compromise
among three different conditions, each one applied separately
leading to a different solution:
- 1.
- The curve should be smooth (i.e., minimizing S);
- 2.
- The smoothed values should be close to the observed values
of the function (i.e., minimizing F);
- 3.
- The first derivatives of the smoothed curve should be close
to the observed values of first derivatives (i.e., minimizing
 ).
).
The adjustment is then done by minimizing a combination of the
constraints above, i.e. the expression
in which
 ,
,
 ,
obviously
leading to the system of N linear equations with unknowns yi.
The degree of compromise among the three conditions is achieved by
choosing the values of two parameters: the coefficients of
smoothing
,
obviously
leading to the system of N linear equations with unknowns yi.
The degree of compromise among the three conditions is achieved by
choosing the values of two parameters: the coefficients of
smoothing
 and
and
 that have
respectively the dimensions [time-6] and [time-4]. The
larger are the values, the larger weight we assign to the fidelity
to the observed function values or their first derivatives, and
the closer the "smoothed'' values are to the observations. To form
these equations, we need to express the partial derivatives of S,
F and
with respect to yi, in terms of the unknowns
yi and .
that have
respectively the dimensions [time-6] and [time-4]. The
larger are the values, the larger weight we assign to the fidelity
to the observed function values or their first derivatives, and
the closer the "smoothed'' values are to the observations. To form
these equations, we need to express the partial derivatives of S,
F and
with respect to yi, in terms of the unknowns
yi and .
The partial derivative of S with respect to yi can be simply
expressed as
in which
and
The partial derivative of function F is even simpler:
More complicated is to express the partial derivatives of ;
they are different for different i, due to different choice
of
in Eq. (9). For sake of shortness, we
are using
in the subsequent equations instead of yi;
their relations are defined by Eqs. (4-7) above. The first
four partial derivatives are
Then follows a group in the first half of the series, for

followed by four derivatives around the center of the series
In the second half of the series, i.e. for i=N/2+3, N/2+4,
 ,
we have
,
we have
and the last four partial derivatives read
2.2 Algorithm to compose the equations
From the preceding subsection it follows that the matrix of the
system of linear Eqs. (10) is sparse, with only seven
diagonals centered around main diagonal containing non-zero
elements. The matrix is symmetric and singular for
 (the sum of elements in the i-th row is equal to
 ). To calculate the elements we use the algorithm described
below.
). To calculate the elements we use the algorithm described
below.
- 1.
- We successively put into each i-th element on the main
diagonal of the matrix the values
,
and we put into the right-hand-sides of the equations the values
 (this part corresponds to constraint F);
- 2.
- For
 we add successively to each
i-th
we add successively to each
i-th  submatrix centered around main diagonal
the matrix
submatrix centered around main diagonal
the matrix
(this part corresponds to constraint S).
- 3.
- For
we successively calculate the matrix
and the column vector
from  ,
,
 ,
,
 ,
,
 given by one
of the Eqs. (4), (5), (6) or
(7), depending on i.
given by one
of the Eqs. (4), (5), (6) or
(7), depending on i.
If i=1, we add them respectively to the first submatrix centered around the main diagonal (i.e., to the one with
indices 1, 2, 3 and 4) and to the four corresponding
right-hand-sides.
If
 ,
we add them respectively to the
submatrices centered around the main diagonal with indices
i-1, i, i+1 and i+2 and to the four corresponding
right-hand-sides.
,
we add them respectively to the
submatrices centered around the main diagonal with indices
i-1, i, i+1 and i+2 and to the four corresponding
right-hand-sides.
If
 ,
we add them respectively to the
submatrices centered around the main diagonal with
indices i-2, i-1, i and i+1 and to the four corresponding
right-hand-sides.
,
we add them respectively to the
submatrices centered around the main diagonal with
indices i-2, i-1, i and i+1 and to the four corresponding
right-hand-sides.
Finally, if i=N, we add them to the last
submatrix
centered around the main diagonal (i.e., to the one with indices
N-3, N-2, N-1 and N) and to the four corresponding
right-hand-sides.
(this part corresponds to constraint ).
If we wish to normalize the weights in both input series (i.e., if
we require that the average weights in Series 1 and Series 2 are
identically equal to unity), we simply replace  in the
expressions above by
in the
expressions above by
 ,
,
 ,
respectively. The software that we use in all subsequent tests and
examples follows namely this approach.
,
respectively. The software that we use in all subsequent tests and
examples follows namely this approach.
By solving the system of linear equations formed above we arrive
at the smoothed function values yi, referred to the instants
xi; to obtain the smoothed first derivative values ,
the constraints (4), (5), (6) or
(7) are then used.
To solve the system, we can use a standard Gaussian elimination
method, as proposed in original smoothing (Vondrák 1969).
This is a very simple and straightforward procedure in which we
can easily make use of the important properties of the matrix; it
is symmetric and sparse.
However, as we shall prove, the system is positive definite and we
know that the symmetric factorization exists and moreover is
stable to compute. Apart from the unknowns we sometimes need to
estimate the uncertainties of the smoothed values or their
functions. Therefore we follow a similar procedure as proposed by
us for the case of observed values without first derivatives
(Cepek & Vondrák 2000) enabling to calculate
easily not only the unknowns but also their covariances.
In matrix notation we can rewrite the system of
Eqs. (10) simply as
 |
(10) |
where submatrices
 have the form
and
Matrix A is a symmetric band matrix. The bandwidth of
A is equal to only three
We store only the symmetric part of the matrix A in N by
3+1 vectors.
Following the algorithm to compose the equations given in the
Sect. 2.2 we can express the matrix as the summation
where the structure of coefficients in all diagonal blocks is
All diagonal elements
are nonnegative and all
diagonal blocks  are clearly positive semidefinite.
Resulting matrix
are clearly positive semidefinite.
Resulting matrix  is thus positive semidefinite as well.
Supposing that the matrix
is regular, it follows that the
semidefinite symmetric matrix
is positive definite and we
can use Cholesky factorization to solve the system (10).
We use the variant of Cholesky factorization
where D is diagonal matrix and U is upper triangular
matrix with unit diagonal. The bandwidth
 is the
same as the bandwidth of A. With the unique Cholesky
factorization of matrix A the solution of system of
Eqs. (10) is obtained simply by solving two band
triangular systems (forward and backward substitution)
is the
same as the bandwidth of A. With the unique Cholesky
factorization of matrix A the solution of system of
Eqs. (10) is obtained simply by solving two band
triangular systems (forward and backward substitution)
We can estimate the standard deviation of smoothed values from
(2) as
Smoothed values are linear combinations of observed values
Its covariance matrix
 is, according to the
general principle of propagation of variances and covariances of
linear functions
is, according to the
general principle of propagation of variances and covariances of
linear functions
 |
(11) |
In the special case of smoothing observations without measured
time derivatives, vector
 and submatrix
  are missing in the Eq. (10), inverse of
is a band matrix and we can compute only
selected subset band of
as described in
(Cepek & Vondrák 2000). With measured first
derivatives we have to invert the full matrix
to express
covariances of smoothed values
are missing in the Eq. (10), inverse of
is a band matrix and we can compute only
selected subset band of
as described in
(Cepek & Vondrák 2000). With measured first
derivatives we have to invert the full matrix
to express
covariances of smoothed values  ,
but inverting symmetric
positive matrix is an easy task and we can exploit the fact that
variance-covariance matrix
,
but inverting symmetric
positive matrix is an easy task and we can exploit the fact that
variance-covariance matrix
 is a band matrix with
bandwidth three.
is a band matrix with
bandwidth three.
2.4 Some properties of the filter, choice of coefficients of
smoothing
As already stated above, the matrix of the system is singular for
(this is equivalent to a case when we have
observations of first derivatives only); in such a case, there
exists no unique solution of the problem unless we impose an
additional constraint. This can be done, e.g., by requiring that
the smoothed curve runs through one point, either observed or
arbitrarily chosen. In this case, we can simply put 1 into the
main diagonal of any row of the matrix (see step 1 of
Sect. 2.2) and the chosen function value to the corresponding
right-hand-side. From this also follows that we always need at
least one observation of function value with non-zero weight (the
observations of first derivatives alone are not sufficient).
On the other hand, there arises no problem at all if
 and
and
 (equivalent to a case
with no observations of first derivatives); in this case, the
problem reduces to original smoothing, and the observed first
derivatives are simply ignored.
(equivalent to a case
with no observations of first derivatives); in this case, the
problem reduces to original smoothing, and the observed first
derivatives are simply ignored.
A really serious problem arises only if both
and
.
Then we have a singular matrix with the
deficiency equal to three, and any quadratic parabola satisfies
the system of Eqs. (10). Then we have a freedom of
choosing three additional constraints (not linearly dependent);
e.g., we can choose any three values (at different epochs) on the
curve, we can do a quadratic regression to the observed function
values, a combined regression to fit the parabola both to observed
function and first derivative values, etc.
There is a close relation between the coefficients of smoothing
and the transfer function T of the filter (i.e., the ratio
between the amplitude of the smoothed curve and the observed
amplitude of a periodic function with frequency f). The transfer
function for the function values (identical with the original
smoothing) was analytically expressed by Huang & Zhou
(1981,1982), assuming the weights pi equal to unity,
as
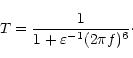 |
(12) |
Similarly, we can express the transfer function  for the
observed first derivatives in terms of
and
frequency f:
for the
observed first derivatives in terms of
and
frequency f:
 |
(13) |
Both transfer functions are graphically displayed in
Figs. 2 and 3, where they are plotted
against dimensionless arguments
 and
and
 (P=1/f is the period) in logarithmic scale.
![\begin{figure}
\par\hspace*{0mm} \includegraphics[width=8.8cm,clip]{jv9736f2.eps} \end{figure}](/articles/aas/full/2000/20/ds9736/Timg134.gif) |
Figure 2:
Transfer function T for the measured function values, plotted
as function of
|
![\begin{figure}
\par\hspace*{0mm} \includegraphics[width=8.8cm,clip]{jv9736f3.eps} \end{figure}](/articles/aas/full/2000/20/ds9736/Timg136.gif) |
Figure 3:
Transfer function
for the measured first derivatives,
plotted as function of
 |
![\begin{figure}
\par\includegraphics[width=12cm,clip]{jv9736f4.eps} \end{figure}](/articles/aas/full/2000/20/ds9736/Timg138.gif) |
Figure 4:
Combined smoothing of simulated data, consisting of three
harmonic oscillations plus random noise. Grey triangles in subplots
a) (function values y) and c) (values of first derivative  )
represent the input data, full, dashed and dotted lines in the same
subplots depict the smoothed curves with stronger and stronger smoothing.
Differences between the weakest smoothing (full lines in subplots a, c))
and original signal are displayed as crosses in subplots b) and d),
in highly enlarged scale )
represent the input data, full, dashed and dotted lines in the same
subplots depict the smoothed curves with stronger and stronger smoothing.
Differences between the weakest smoothing (full lines in subplots a, c))
and original signal are displayed as crosses in subplots b) and d),
in highly enlarged scale |
![\begin{figure}
\par\includegraphics[width=12cm,clip]{jv9736f5.eps} \end{figure}](/articles/aas/full/2000/20/ds9736/Timg139.gif) |
Figure 5:
Combined smoothing of UT1R-TAI measured by VLBI and lodR
measured by GPS, using
= 25 102 day-6,
= 4 104 day-4 (leading to dispersions
equal to formal standard errors). Smoothed curves are shown as
full lines and residuals (enlarged scale on the right) as grey
crosses. Reduced values of UT1R-TAI+27.5+0.00183(MJD-48987)
are displayed in top, lodR in bottom |
It is necessary
to say that these transfer functions are strictly valid only in
cases when either only function values, or only first derivatives
(plus one arbitrarily chosen function value, as mentioned above)
are observed. When both types of observations are mixed in one
solution, a transfer function lying somewhere between the two is
reflected in the smoothed series, depending on the ratio of the
numbers of both types of observation.
In principle, there are two possibilities of choosing the
coefficients of smoothing
and
,
both requiring at least an approximate a priori knowledge of the
observed process; we should have a realistic estimation of either
the precision of the measurement, or the shortest period contained
in the signal:
- 1.
- Knowing a priori average values of standard errors
in Series 1 and 2, we try to find such coefficients of smoothing
that would yield the same estimated a posteriori standard
errors from the dispersion of observations around the smoothed
curve (these can be easily obtained as
 ).
This approach requires the solution in several steps, by
iterations. It often appears that the satisfactory solution is
impossible to find, especially if the a priori standard
errors are unrealistically small and both series of observed
values and first derivatives are not mutually compatible on this
level of accuracy (see next sections for tests with simulated
data, practical examples and more detailed discussion). Then
higher values than a priori standard errors must be used, or
the following possibility of choosing coefficients of smoothing
should be taken;
).
This approach requires the solution in several steps, by
iterations. It often appears that the satisfactory solution is
impossible to find, especially if the a priori standard
errors are unrealistically small and both series of observed
values and first derivatives are not mutually compatible on this
level of accuracy (see next sections for tests with simulated
data, practical examples and more detailed discussion). Then
higher values than a priori standard errors must be used, or
the following possibility of choosing coefficients of smoothing
should be taken;
- 2.
- Knowing in advance which frequencies we aim to suppress in
both observed series, we use the transfer functions of
Eqs. (12), (13) to calculate the
corresponding values of
and
,
and
use the method as a low pass filter. Here we can apply a very
simple rule; denoting the period for which half of the amplitude
is suppressed as P0.5, i.e. corresponding to
 (shorter periods are suppressed more, longer periods less), we
calculate both coefficients of smoothing as
(shorter periods are suppressed more, longer periods less), we
calculate both coefficients of smoothing as
 |
(14) |
Alternatively, slightly different formulas hold for calculating
the coefficients of smoothing if we wish to pass 99% of the
amplitude of a periodic process with period P0.99(corresponding to
 ):
):
This approach is especially suitable in cases when we require more
heavily smoothed series (with only low frequencies retained) for
special analyses, or if we apply the method twice, to retain only
the frequencies in a specific frequency range as proposed for
original smoothing in (Vondrák 1977).
2.5 Testing the method with simulated data
Before using the method with real observations, it is reasonable
to test it with simulated data, with the expected results to be
known beforehand. We selected simulated data series that are very
similar to what can be encountered in reality. Namely we used the
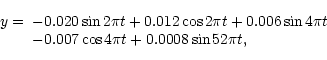
signal resembling UT1 series, consisting of three periodic terms
- annual, semi-annual and fortnightly - of the form (in time
seconds):
in which
t=(x-50448)/365.2422 is the argument expressed in
years. Its first derivative with respect to time argument x is
then
We generated the series y,
at one-day spacing, covering
the interval 400 days long, and added to both of them Gaussian
random noise with rms dispersion equal to
 and
/day, respectively. Both series (in which all weights
were put equal to 1) were then subject to combined smoothing
described above, using numerous pairs of coefficients of smoothing
,
.
The tests led to thefollowing
findings:
and
/day, respectively. Both series (in which all weights
were put equal to 1) were then subject to combined smoothing
described above, using numerous pairs of coefficients of smoothing
,
.
The tests led to thefollowing
findings:
- In order to get the best approximation of the signal, it is
recommendable to choose the values
 ,
,
 as given by Eqs. (14) for
P0.5 lying approximately between one third and one half of
the shortest known period contained in the signal. Alternatively,
it is also possible to calculate
as given by Eqs. (14) for
P0.5 lying approximately between one third and one half of
the shortest known period contained in the signal. Alternatively,
it is also possible to calculate
 ,
,
 from Eqs. (15), in which
we put P0.99 equal to the shortest known period of the
signal. Any values of
,
lying in
the vicinity
from Eqs. (15), in which
we put P0.99 equal to the shortest known period of the
signal. Any values of
,
lying in
the vicinity
of these yield approximately the same acceptable
results;
- Substantially larger values of
,
than given above lead to more "ragged'' curves in
which the noise of the observations is less suppressed;
- Using substantially smaller values of
,
leads to smoother curves in which the
short-periodic part of the signal is suppressed;
- Using substantially smaller value of
(with
kept according to the rule above) does not do much
harm; it only applies lower weights to all observed first
derivatives (extreme case
neglects these
observations completely). This variant can be used if we are sure
that the quality of these observations is not very good;
- Using substantially larger value of
(keeping
as calculated above) leads generally to
unsatisfactory results, especially if the epochs of both series do
not coincide (see the first example with real data in
Sect. 3 below).
An illustration of combining the simulated data with different
values of
,
is given in
Fig. 4.
The simulated observations of y (plot a) and
(plot c) are depicted as grey triangles. Three
different sets of
,
are used:
- 1.
-
 ,
leading to a quadratic
function of y, and a straight line of ,
both being
calculated as best fit to both data series. These results are
displayed as dotted lines;
,
leading to a quadratic
function of y, and a straight line of ,
both being
calculated as best fit to both data series. These results are
displayed as dotted lines;
- 2.
-
 day-6,
 day-4 (corresponding to
P0.5=75days), given as dashed lines. This estimator almost exactly
follows the annual and semi-annual term and completely suppresses
the fortnightly term;
day-4 (corresponding to
P0.5=75days), given as dashed lines. This estimator almost exactly
follows the annual and semi-annual term and completely suppresses
the fortnightly term;
- 3.
-
 day-6,
 day-4 (corresponding to P0.5=5 days), represented
by full lines. It almost perfectly reproduces the complete signal.
The differences of this smoothed curve from either "observed''
values or the signal are so small that they cannot be seen in the
given scale. Therefore, the differences between the smoothed
curves and the original signal are displayed in the same graph,
highly enlarged (1000 and 100 times in plots b and d,
respectively). The rms difference between the smoothed curves of
y and
and the original signal is respectively
day-4 (corresponding to P0.5=5 days), represented
by full lines. It almost perfectly reproduces the complete signal.
The differences of this smoothed curve from either "observed''
values or the signal are so small that they cannot be seen in the
given scale. Therefore, the differences between the smoothed
curves and the original signal are displayed in the same graph,
highly enlarged (1000 and 100 times in plots b and d,
respectively). The rms difference between the smoothed curves of
y and
and the original signal is respectively
 and
and
 /day, which are equal approximately to only one
half of the noise in the input data.
/day, which are equal approximately to only one
half of the noise in the input data.
We also made a number of tests with the same simulated data in
which the function values y, sampled only once per 7 days, were
combined with
values at daily intervals. We also made
tests with the epochs of y shifted with respect to
by
small fractions of the day (0.1d and 0.01d). The results were
almost equivalent to the previous ones, and we came to conclusion
that the same rules of choosing the coefficients
,
as described above can be applied even in these
cases.
Up: Combined smoothing method and
Copyright The European Southern Observatory (ESO)


![\begin{eqnarray*}\frac{\partial{\bar F}}{\partial{y_1}}=\frac{2}{\bar n}
\left[...
...r y_1-\bar y_1')
+\bar p_2\bar a_2(\bar y_2-\bar y_2') \right],
\end{eqnarray*}](/articles/aas/full/2000/20/ds9736/img75.gif)
![\begin{eqnarray*}\frac{\partial{\bar F}}{\partial{y_2}}=\frac{2}{\bar n}
\left[...
...ar y_2-\bar y_2')+
\bar p_3\bar a_3(\bar y_3-\bar y_3')\right],
\end{eqnarray*}](/articles/aas/full/2000/20/ds9736/img76.gif)
![\begin{eqnarray*}\frac{\partial{\bar F}}{\partial{y_3}}&=&\frac{2}{\bar n}
\lef...
...right.\\
&+&\left.\bar p_4\bar a_4(\bar y_4-\bar y_4')\right],
\end{eqnarray*}](/articles/aas/full/2000/20/ds9736/img77.gif)
![\begin{eqnarray*}\frac{\partial{\bar F}}{\partial{y_4}}&=&\frac{2}{\bar n}
\lef...
...ar y_4-\bar y_4')+
\bar p_5\bar a_5(\bar y_5-\bar y_5')\right].
\end{eqnarray*}](/articles/aas/full/2000/20/ds9736/img78.gif)
![\begin{eqnarray*}\frac{\partial{\bar F}}{\partial{y_i}}&=&\frac{2}{\bar n}
\lef...
...eft.\bar p_{i+1}\bar a_{i+1}(\bar y_{i+1}-\bar y_{i+1}')\right],
\end{eqnarray*}](/articles/aas/full/2000/20/ds9736/img80.gif)
![\begin{eqnarray*}\lefteqn{\frac{\partial{\bar F}}{\partial{y_{\frac{N}{2}-1}}}=\...
...{2}+1}(\bar y_{\frac{N}{2}+1}
-\bar y_{\frac{N}{2}+1}')\right],
\end{eqnarray*}](/articles/aas/full/2000/20/ds9736/img81.gif)
![\begin{eqnarray*}\lefteqn{\frac{\partial{\bar F}}{\partial{y_{\frac{N}{2}}}}=\fr...
...{2}+2}(\bar y_{\frac{N}{2}+2}
-\bar y_{\frac{N}{2}+2}')\right],
\end{eqnarray*}](/articles/aas/full/2000/20/ds9736/img82.gif)
![\begin{eqnarray*}\lefteqn{\frac{\partial{\bar F}}{\partial{y_{\frac{N}{2}+1}}}=\...
...{2}+3}(\bar y_{\frac{N}{2}+3}
-\bar y_{\frac{N}{2}+3}')\right],
\end{eqnarray*}](/articles/aas/full/2000/20/ds9736/img83.gif)
![\begin{eqnarray*}\lefteqn{\frac{\partial{\bar F}}{\partial{y_{\frac{N}{2}+2}}}=\...
...{2}+4}(\bar y_{\frac{N}{2}+4}
-\bar y_{\frac{N}{2}+4}')\right].
\end{eqnarray*}](/articles/aas/full/2000/20/ds9736/img84.gif)
![\begin{eqnarray*}\lefteqn{\frac{\partial{\bar F}}{\partial{y_i}}=
\frac{2}{\bar...
...)+
\bar p_{i+2}\bar a_{i+2}(\bar y_{i+2}-\bar y_{i+2}')\right],
\end{eqnarray*}](/articles/aas/full/2000/20/ds9736/img86.gif)
![\begin{eqnarray*}\lefteqn{\frac{\partial{\bar F}}{\partial{y_{N-3}}}=
\frac{2}{...
...1}-\bar y_{N-1}')+
\bar p_N\bar a_N(\bar y_N-\bar y_N')\right],
\end{eqnarray*}](/articles/aas/full/2000/20/ds9736/img87.gif)
![\begin{eqnarray*}\lefteqn{\frac{\partial{\bar F}}{\partial{y_{N-2}}}=\frac{2}{\b...
...1}-\bar y_{N-1}')+
\bar p_N\bar b_N(\bar y_N-\bar y_N')\right],
\end{eqnarray*}](/articles/aas/full/2000/20/ds9736/img88.gif)
![\begin{eqnarray*}\lefteqn{\frac{\partial{\bar F}}{\partial{y_{N-1}}}=\frac{2}{\b...
...1}-\bar y_{N-1}')
+\bar p_N\bar c_N(\bar y_N-\bar y_N')\right],
\end{eqnarray*}](/articles/aas/full/2000/20/ds9736/img89.gif)
![\begin{eqnarray*}\lefteqn{\frac{\partial{\bar F}}{\partial{y_N}}=\frac{2}{\bar n...
...ight.}\\
&&+\left.\bar p_N\bar d_N(\bar y_N-\bar y_N')\right].
\end{eqnarray*}](/articles/aas/full/2000/20/ds9736/img90.gif)


![\begin{figure}
\par\includegraphics[width=8.8cm,clip]{jv9736f1.eps} \end{figure}](/articles/aas/full/2000/20/ds9736/img11.gif)


![\begin{figure}
\par\includegraphics[width=12cm,clip]{jv9736f4.eps} \end{figure}](/articles/aas/full/2000/20/ds9736/img138.gif)
![\begin{figure}
\par\includegraphics[width=12cm,clip]{jv9736f5.eps} \end{figure}](/articles/aas/full/2000/20/ds9736/img139.gif)
