 |
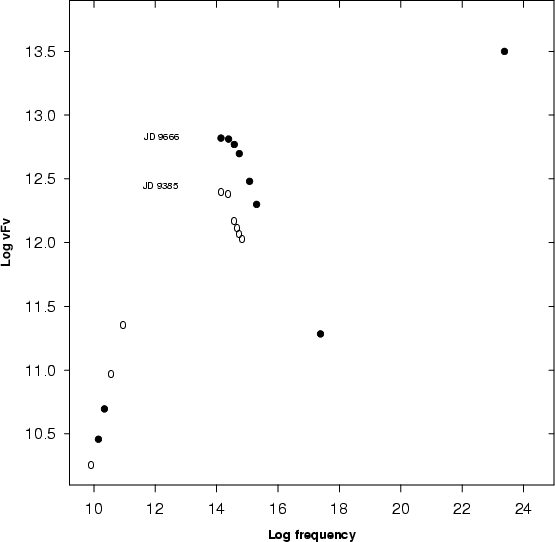
Figure 13: Examples of the spectral energy distribution and its variability. The dates indicate the Julian date of the observations |
We have presented the best ever observed light curves of BL Lac object OJ 287. The predicted outbursts have been confirmed in the UV, optical and infrared bands, the second one also in radio frequencies. This can be seen from Fig. 12, where we display the observed light curves in selected wavelengths from UV to radio. The first outburst is clearly seen simulaneously in all other bands except in radio, which showed low flux levels. During the second optical outburst radio bands also showed increased flux values (unfortunately we have no infrared or UV data at this time), this could be a coincidence or could also indicate time delays between these frequencies (see Valtaoja et al. 2000 for a possible explanation). This intensive monitoring clearly suggests that (at least) in the optical bands OJ 287 is varying to the shortest time scales studied here.
In Fig. 13 we show examples of the observed spectral energy distribution (SED) during the observations. These spectra are collected from observations taken almost simultaneously, in any case within a day in radio to optical bands. The satellite observations in X-ray and gamma frequences cannot be considered truly simultaneous, since the observations lasted a few days, and we present only the averaged values. As can be seen there is very little variations in the radio part of the spectrum. But in the infrared and optical frequencies there are substantial variations in the flux levels and smaller ones in the spectral shape. JD 9666 refers to the time of the first optical outburst when we also had satellite observations on OJ 287, the other spectrum was observed before the outburst.
This project has produced a huge data base for studying the behaviour of blazars, but it seems that it has also raised a lot of new questions instead of giving definite answers to questions of blazar phenomenon (see e.g. Marscher 1998; Valtaoja 1998). Detailed analysis of these data is expected to give some indications of the emission regions and mechanisms in these objects. Especially intriguing is the question of the difference between the radio behaviour during the two optical outbursts, this fact may help us to discriminate between different models explaining the outbursts. But, it may well be that we have to wait until the next outburst at 2006/7 for a deeper understanding of OJ 287.
Acknowledgements
This work was partly supported by the Academy of Finland. We would like to thank the CCI for granting us the International observing time at the La Palma telescopes. This work was partly supported by the Italian Ministry for University and Research (MURST) under grant Cofin98-02-32 and by the Italian Space Agengy (ASI). This work was also partly supported by DFG (Sonderforschungsbereich 328). We would also like to thank University of Michigan and NSF for partial funding for the Michigan radio monitoring program.
Copyright The European Southern Observatory (ESO)