 |
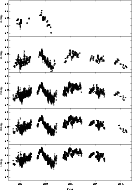
Figure 2: The optical light curves of OJ 287 observed during the OJ-94 project |
Observations presented here were collected during the OJ-94 project between autumn 1993 and spring 1998. The observatories and instruments used are listed in Table 1. Some of these instruments are automatic telescopes, like the one in Perugia (Fiorucci & Tosti 1996b) and RoboScope (Honeycutt & Turner 1992). Most of the optical observations were taken using CCD-cameras. With these cameras we performed differential photometry, comparing the brightness of OJ 287 to the stars in the same image. The calibration stars used are stars 10, 11, and 4 (Smith et al. 1985). During this program we have recalibrated the stars (e.g. Fiorucci & Tosti 1996a). The new calibrations agree quite well with the old ones. All the observers were responsible for the reduction of their own observations. The CCD observations were reduced using different reduction programs, like IRAF and MIDAS and some locally developed software (Fiorucci & Tosti 1996a; Honeycutt 1992; Villata et al. 1997; Lanteri 1999). In all cases the standard bias and flatfield corrections were performed. We have also received a large number of visual brightness estimates from the Astronomer Organization from UK. These estimates can be used for settling the brightness level of OJ 287 on those nights, when we do not have other observations of it.
 |
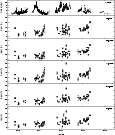
Figure 4: The polarisation level in different optical bands observed in OJ 287 during the OJ-94 project |
All the optical polarisation observations were made using similar UBVRI photopolarimeter both at Crimea and at the NOT. The instrument is a double image chopping photopolarimeter developed by Piirola (1973, 1975, 1988). With this instrument one obtains strictly simultaneous polarimetric and photometric measurements in the five (UBVRI) bands (see Huovelin & Piirola 1990; Piirola 1988). The light is split into the five bands using four dichroic filters, which reflect the desired spectral interval light into a photomultiplier and transmit the other wavelenghts. The effective bands produced by the dichroic mirrors are close to the standard Johnson system. Polarisation and photometric calibration stars were observed every night. Details of the instrument and observing procedures can be found from Efimov & Shakhovskoy (1998), Piirola (1988) and Takalo (1991). The data reductions were made using programs developed specifically for this instrument (Piirola 1973, 1975).
The infrared data were collected mostly at the 1.5 m Carlos Sanchez telescope on Tenerife, using a single channel CVF-photometer, with an InSb detector. The CVF permits a sequence of filters to be defined, which allows one to observe nearly simultaneously in all three (JHK) colour bands. For detailed description of the instrumentation, calibrations and data reduction see Takalo et al. (1992) and Kidger et al. (1995). Some infrared data were also obtained using UKIRT on Hawaii.
The radio data are nightly averages collected within radio monitoring programs at Michigan, Metsähovi, and SEST. The University of Michigan monitoring program started already during 1965. Currenly they observe at three frequencies, 4.8, 8 and 14.8 GHz, obtaining simultaneously both flux and polarisation measurements. Detailed description of the instrumentation and reduction procedures can be found from Aller et al. (1985). The Metsähovi data at 22 and 37 GHz are part of the long term monitoring program started in 1980. Both receivers have two feed horns with orthogonal polarization giving a mean value of the flux even if the source is polarized. The observations are standard ON-ON type and calibrated against DR 21. The data (only flux measurements) are nightly means. The observing and data reduction procedure is described in more detail in Teräsranta et al. (1998). The observations at the SEST telescope are made at 90 and 230 GHz. Details of the instrumentation, observing strategies and data reduction can be found at Tornikoski et al. (1996).
Small amount of UV data was obtained with the IUE-satellite during the first outburst. We observed OJ 287 with IUE for ten days in November 1994, using both cameras. The spectra were extracted using IUESIPS routine and with a locally developed MIDAS-based version of the GEX procedure (Urry & Reichert 1988). The flux distributions have been calibrated with the curves provided by Bohlin et al. (1990, SWP) and Casatella et al. (1992, LWP). The extraction of the spectra shows that there is a small systematic difference between the results from different routines, but they are compatible within the errors. We will use only the GEX extracted spectra in the following analysis. These UV data were dereddened for the Galactic interstellar extinction, using Av = 0.18 (Stark et al. 1992). The dereddened spectra were coadded in order to increase the signal-to-noise ratio, searching for spectral features, but no emission features were found.
The project archive contains also the data published by Arimoto et al. (1997), Fan et al. (1998b), Jia et al. (1998) and Stevens et al. (1994). These data will be also used in the following sections of this article.
All the reduced observations were sent to the project archive, which is maintained at Tuorla Observatory. Optical data were sent to the archive in two different formats, either in OJ 287 magnitudes or as differences between OJ 287 and the calibration stars. The archivists (T. Pursimo & H. Lehto) then transformed the optical data into one format; magnitudes and errors. The archive contains now about 10000 optical, 200 infrared, and 2000 radio observations on OJ 287. No "screening'' of the data has been performed, ALL the data sent to the archive has been used here. This is by far the largest data collection on any extragalactic object. The archive can be accessed from the project home page (http://www.astro.utu.fi/oj94). A description of the archive can be found from Pursimo et al. (1998). The photometric data available in the archive and used here are mostly hourly averages in the optical and infrared bands. These averages are calculated for a single telescope, i.e. if a telescope observed OJ 287 within an hour we calculate the average, but if several telescopes observed OJ 287 during a particular hour, we calculate the average datapoint for each telescope. In the optical bands some data with better time resolution is also available in the archive. The radio and optical polarisation data are nightly averages.
Copyright The European Southern Observatory (ESO)