For each of the sample galaxies we calculated dynamical models using
the method described above, for a series of potentials (between 20 and
150 per galaxy). A given potential can be parametrized by the value of
the circular velocity at the radius of the last kinematic data point,
![]() .
.
![]() diagrams (plots of resulting model
diagrams (plots of resulting model ![]() against
against
![]() )
together with confidence intervals as
described in Sect. 4.2 are shown in Figs. 10 (for the
sample with new kinematic data) and 11 (for the sample with
spectroscopic data from BSG94). This grouping is maintained in
subsequent plots because of the different radial range covered by the
two sets of kinematic data. From these figures we select three
models for each galaxy: two from the boundaries of the confidence
interval and one of the best-fitting models from the middle of the
confidence range. These models are depicted with the same linestyles
in all the plots to follow: dashed lines for the two boundary models,
and a solid line for the respective "best'' model. Note that this
"best'' model does not necessarily have the smallest value of
)
together with confidence intervals as
described in Sect. 4.2 are shown in Figs. 10 (for the
sample with new kinematic data) and 11 (for the sample with
spectroscopic data from BSG94). This grouping is maintained in
subsequent plots because of the different radial range covered by the
two sets of kinematic data. From these figures we select three
models for each galaxy: two from the boundaries of the confidence
interval and one of the best-fitting models from the middle of the
confidence range. These models are depicted with the same linestyles
in all the plots to follow: dashed lines for the two boundary models,
and a solid line for the respective "best'' model. Note that this
"best'' model does not necessarily have the smallest value of
![]() since it is chosen in the middle of the range of valid
models. In figures showing model fits to the kinematic data, or in
circular velocity curve plots, the self-consistent (SC) models are
additionally shown as dotted lines.
since it is chosen in the middle of the range of valid
models. In figures showing model fits to the kinematic data, or in
circular velocity curve plots, the self-consistent (SC) models are
additionally shown as dotted lines.
Figures 12 to 17 present the model fits to the
kinematic data for all galaxies analysed. For each galaxy three panels
are shown: the upper panel shows the velocity dispersion ![]() ,
the
middle panel shows the h4 parameter, and the lower panel shows the
intrinsic anisotropy parameter
,
the
middle panel shows the h4 parameter, and the lower panel shows the
intrinsic anisotropy parameter ![]() defined as
defined as
 |
(2) |
The derived anisotropy profiles are surprisingly uniform. For most
galaxies, the best-fit models are moderately anisotropic at
![]() ,
with typical
,
with typical
![]() ,
in a few cases
,
in a few cases
![]() .
Towards the
center most turn towards isotropy; a clear exception is NGC 2434. In
a number of galaxies the transition to a near-isotropic center occurs
in the inner 3'' and is uncertain because of the low spatial
resolution of the data; in others, however, it starts at
.
Towards the
center most turn towards isotropy; a clear exception is NGC 2434. In
a number of galaxies the transition to a near-isotropic center occurs
in the inner 3'' and is uncertain because of the low spatial
resolution of the data; in others, however, it starts at
![]() and is therefore real (NGC 4374, 3379, 4168, 4472, 4486). We
have also checked, using the data for NGC 1399, that the shape of the
inner anisotropy profile is not dependent on the set of basis
functions used in the modelling; see Fig. 12 and Sect.
5.3. In the outer parts, the
and is therefore real (NGC 4374, 3379, 4168, 4472, 4486). We
have also checked, using the data for NGC 1399, that the shape of the
inner anisotropy profile is not dependent on the set of basis
functions used in the modelling; see Fig. 12 and Sect.
5.3. In the outer parts, the ![]() -profiles also
generally turn back towards isotropy or even tangential anisotropy,
but due to the finite range of the kinematic data, the detailed values
near the outer edge depend on the halo mass distribution and the
errors on
-profiles also
generally turn back towards isotropy or even tangential anisotropy,
but due to the finite range of the kinematic data, the detailed values
near the outer edge depend on the halo mass distribution and the
errors on ![]() there are large.
there are large.
The circular velocity curves (CVCs) resulting from these model
potentials are shown in Figs. 18 and 19. They are
plotted as a function of
![]() ,
and extend to the radius of the
outermost kinematic data point. All CVCs are consistent with being
flat outside
,
and extend to the radius of the
outermost kinematic data point. All CVCs are consistent with being
flat outside
![]() at the
at the ![]() level. Extended flat
rotation curves, however, can only be demonstrated for about eight of
the galaxies with new kinematic data. In some of these, e.g., NGC
1399, 3379, the CVC rises to a maximum at
level. Extended flat
rotation curves, however, can only be demonstrated for about eight of
the galaxies with new kinematic data. In some of these, e.g., NGC
1399, 3379, the CVC rises to a maximum at
![]() ,
before falling by about
,
before falling by about ![]() to reach the flat part at
to reach the flat part at
![]() .
In others, e.g., NGC 2434, 7626, no such maximum is seen before
the flat part of the CVC is reached. In some, e.g., NGC 315, the
situation is unclear because the data do not extend far enough. The
same is true for many of the galaxies from the BSG94 sample, where also
in some cases the poorer quality of the data (e.g., in NGC 4486B)
causes additional uncertainty.
.
In others, e.g., NGC 2434, 7626, no such maximum is seen before
the flat part of the CVC is reached. In some, e.g., NGC 315, the
situation is unclear because the data do not extend far enough. The
same is true for many of the galaxies from the BSG94 sample, where also
in some cases the poorer quality of the data (e.g., in NGC 4486B)
causes additional uncertainty.
Figures 20 and 21 show the corresponding cumulative
mass-to-light ratios in the B-band for all sample galaxies. For each
case, the permitted range is indicated by plotting the two boundary
models and the "best'' model from the central region of the
confidence interval. Numerical values for the central and total
mass-to-light ratios within the range of the kinematic data are given
in Table 7.
| low | best | high | low | best | high | low | best | high | ||
| NGC |
|
|
|
|
|
|
|
|
|
|
| 315 | 521.6 | 568.7 | 639.7 | 11.0 | 10.5 | 9.6 | 1.468 | 1.830 | 2.533 | |
| 1399 | 373.8 | 424.1 | 466.1 | 10.9 | 10.6 | 10.1 | 1.060 | 1.392 | 1.769 | |
| 2434 | 288.2 | 331.0 | 371.6 | 6.2 | 6.0 | 6.4 | 1.417 | 1.918 | 2.253 | |
| 3193 | 283.9 | 303.0 | 334.7 | 5.0 | 4.5 | 3.6 | 1.000 | 1.396 | 2.129 | |
| 3379 | 241.5 | 259.3 | 286.7 | 4.7 | 4.5 | 4.2 | 1.000 | 1.219 | 1.602 | |
| 3640 | 270.8 | 279.2 | 288.2 | 3.7 | 3.6 | 3.7 | 3.7 | 1.004 | 1.030 | 1.097 |
| 4168 | 264.7 | 286.8 | 306.2 | 6.5 | 6.1 | 5.8 | 5.4 | 1.058 | 1.295 | 1.602 |
| 4278 | 398.2 | 415.9 | 424.4 | 8.8 | 8.6 | 7.6 | 6.4 | 1.005 | 1.244 | 1.544 |
| 4374 | 380.8 | 409.7 | 441.8 | 9.5 | 8.7 | 8.8 | 8.3 | 1.023 | 1.168 | 1.457 |
| 4472 | 429.9 | 463.7 | 502.0 | 7.8 | 6.7 | 7.0 | 6.5 | 1.022 | 1.134 | 1.450 |
| 4486 | 491.9 | 506.5 | 566.9 | 11.8 | 10.9 | 9.4 | 8.1 | 1.044 | 1.280 | 1.853 |
| 4486B | 233.9 | 248.7 | 268.5 | 7.2 | 7.2 | 6.2 | 1.000 | 1.128 | 1.543 | |
| 4494 | 238.2 | 260.8 | 287.5 | 7.4 | 7.3 | 6.5 | 5.9 | 1.008 | 1.369 | 1.829 |
| 4589 | 311.7 | 333.2 | 355.7 | 6.0 | 5.4 | 5.4 | 5.4 | 1.088 | 1.258 | 1.457 |
| 4636 | 325.6 | 341.3 | 351.8 | 9.6 | 8.7 | 8.9 | 7.8 | 1.027 | 1.109 | 1.336 |
| 5846 | 328.5 | 338.3 | 346.0 | 10.1 | 9.7 | 9.5 | 1.053 | 1.164 | 1.244 | |
| 6703 | 190.5 | 221.8 | 248.4 | 5.6 | 5.2 | 5.0 | 1.000 | 1.452 | 1.885 | |
| 7145 | 193.0 | 210.2 | 254.5 | 3.5 | 3.9 | 3.7 | 1.922 | 2.026 | 3.162 | |
| 7192 | 256.6 | 269.9 | 292.0 | 5.1 | 4.6 | 4.7 | 1.332 | 1.643 | 1.876 | |
| 7507 | 350.6 | 399.0 | 471.8 | 6.2 | 5.9 | 5.9 | 1.417 | 1.937 | 2.700 | |
| 7626 | 372.9 | 401.3 | 437.5 | 9.0 | 8.1 | 7.8 | 1.406 | 1.814 | 2.223 |
| NGC |
|
|
M/L1/2 |
|
|
|
M/L1/2 |
| vdM | Lauer | SBS | SBS | ||||
| 1399 | 10.6 | 14.7 | 15.5 | 8.8 | - | 10.2 | 16.4 |
| 3379 | 4.5 | 5.5 | 5.1 | 4.7 | 8.3 | 6.0 | 10.2 |
| 4278 | 7.6 | 9.5 | 12.5 | - | - | 8.8 | 11.1 |
| 4374 | 8.8 | 10.3 | 11.1 | 9.7 | 9.4 | 7.0 | 17.5 |
| 4472 | 7.0 | 8.0 | 11.9 | 8.0 | 10.9 | 6.3 | 9.6 |
| 4486 | 9.4 | 12.0 | 26.1 | 10.2 | - | 7.5 | 11.3 |
| 4494 | 6.5 | 8.9 | - | 11.6 | - | - | - |
| 4636 | 8.9 | 9.8 | 17.6 | 9.1 | 13.3 | 10.5 | 14.4 |
| 5846 | 9.7 | 11.3 | - | 10.7 | 12.7 | - | - |
| 6703 | 5.2 | 7.6 | - | - | 6.4 | - | - |
| 7145 | 3.9 | 8.0 | - | 6.4 | - | - | - |
| 7507 | 5.9 | 11.3 | 10.1 | 5.5 | - | 5.21 | 11.31 |
| 7626 | 8.1 | 14.7 | 12.7 | 8.3 | 10.3 | 7.7 | 10.5 |
| (1) From Bertin et al. ([1994]) using the same modelling. | |||||||
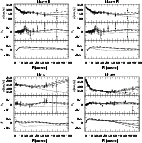 |
Figure 12:
Fits to the kinematic data of NGC 3379 using
B-band photometry (top left), NGC 3379 again but using R-band
photometry (top right), NGC 315 (bottom left), and NGC 1399 (bottom
right). In each panel the uppermost of the three plots shows the
velocity dispersion, the middle plot the h4 parameter, and the
lower plot the intrinisic velocity anisotropy parameter |
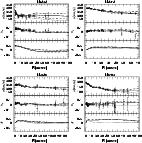 |
Figure 13: As in Fig. 12 for NGC 2434 (top left), NGC 4374 (top right), NGC 5846 (bottom right) and NGC 6703 (bottom right) |
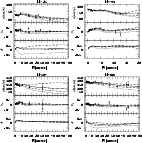 |
Figure 14: As in Fig. 12 for NGC 7145 (top left), NGC 7192 (top right), NGC 7507 (bottom left) and NGC 7626 (bottom right) |
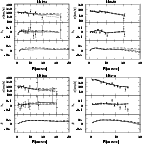 |
Figure 15: As in Fig. 12 for NGC 3193 (top left), NGC 3640 (top right), NGC 4168 (bottom left) and NGC 4278 (bottom right) |
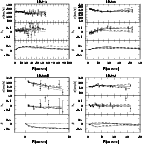 |
Figure 16: As in Fig. 12 for NGC 4472 (top left), NGC 4486 (top right), NGC 4486B (bottom left) and NGC 4494 (bottom right) |
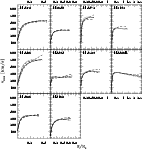 |
Figure 19: Circular velocity curves for the sample with kinematic data from BSG94, as in Fig. 18 |
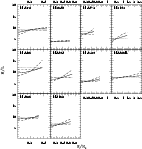 |
Figure 21: Same as Fig. 20 for the sample of galaxies with kinematics from BSG94 |
For all galaxies, the respective "best'' model shows an outward
increase of M/L. However, the increase ranges from very small (NGC
3379) to about a factor of 2 (NGC 2434). Because of the finite
radial range of the data, the modelling will allow some artificially
massive halo models (see G+98 for an explanation). Three of the
galaxies in Fig. 20 (NGC 3379, NGC 4374, NGC 6703) are
consistent with a flat M/L over the range of even the extended
kinematic data (the self-consistent constant-M/L model lies inside
the ![]() -confidence line), although in each case the M/L of the
"best'' model increases outwards. Both in NGC 1399, NGC 5846 the
constant-M/L model lies outside the
-confidence line), although in each case the M/L of the
"best'' model increases outwards. Both in NGC 1399, NGC 5846 the
constant-M/L model lies outside the ![]() -confidence line. In NGC
5846 we consider this only marginal evidence, given the small radial
range covered by the data and the similarity between the models. In
NGC 1399 the weak evidence for dark matter is confirmed by X-ray and
other data; see below. The rising M/L shown by the models in NGC 7145
is influenced strongly by this galaxy's peculiar inner kinematics. The
clearest candidates for radially increasing mass-to-light ratios in
this sample are therefore NGC 315, NGC 2434, NGC 7507, and NGC 7626,
where in each case the self-consistent model is a poor fit to the
data.
-confidence line. In NGC
5846 we consider this only marginal evidence, given the small radial
range covered by the data and the similarity between the models. In
NGC 1399 the weak evidence for dark matter is confirmed by X-ray and
other data; see below. The rising M/L shown by the models in NGC 7145
is influenced strongly by this galaxy's peculiar inner kinematics. The
clearest candidates for radially increasing mass-to-light ratios in
this sample are therefore NGC 315, NGC 2434, NGC 7507, and NGC 7626,
where in each case the self-consistent model is a poor fit to the
data.
In Table 8 we compare our derived mass-to-light ratios with
those determined by van der Marel ([1991]), Lauer ([1985])
and Saglia et al. ([1992]). The values given by the first author
were transformed to the B-band, assuming a mean extinction-corrected
Johnson colour of B-R=1.80. All values were scaled to the distances
used in the present paper. The three
![]() values given for each
galaxy from our analysis are the central value of the respective
"best'' model, corresponding to the "maximal stellar mass''
values given for each
galaxy from our analysis are the central value of the respective
"best'' model, corresponding to the "maximal stellar mass''
![]() of the stellar population, the "best'' cumulative
of the stellar population, the "best'' cumulative
![]() inside the
last kinematic data point, and the "best'' cumulative
inside the
last kinematic data point, and the "best'' cumulative
![]() inside
the half-luminosity radii determined by Saglia et al. ([1992]).
The latter two values thus refer to the total mass (luminous and dark)
out to these radii.
inside
the half-luminosity radii determined by Saglia et al. ([1992]).
The latter two values thus refer to the total mass (luminous and dark)
out to these radii.
Comparing our central values with those of van der Marel
([1991]) shows that the new mass-to-light ratios are similar in
the mean with individual differences generally less than ![]() and
particularly large discrepancies of
and
particularly large discrepancies of ![]() for NGC 7145 and by
a factor of two for NGC 4494. The latter galaxy was off in all of
van der Marel's correlation plots. van der Marel used axisymmetric
two-integral models but did not take into account line-profile shape
information. Because these models have the property of flattening the
mass distribution by equatorial near-circular orbits (Dehnen &
Gerhard [1993]), they generally predicted too much motion on the
major axis and thus van der Marel's M/L values were taken to be weighted
averages of the minor and major axis fits.
for NGC 7145 and by
a factor of two for NGC 4494. The latter galaxy was off in all of
van der Marel's correlation plots. van der Marel used axisymmetric
two-integral models but did not take into account line-profile shape
information. Because these models have the property of flattening the
mass distribution by equatorial near-circular orbits (Dehnen &
Gerhard [1993]), they generally predicted too much motion on the
major axis and thus van der Marel's M/L values were taken to be weighted
averages of the minor and major axis fits.
The mass-to-light ratios given by Lauer ([1985]) are estimates
based on the standard King formula for isotropic cores, and are always
higher than our new determinations. Differences less than ![]() are
observed between our central M/L values and those for the luminous
component of Saglia et al. ([1992]). The M/L ratios computed at
the half-luminosity radii used by Saglia et al. ([1992]) also
agree reasonably well. However, for NGC 3379 and NGC 4374 Saglia et al.
([1992]) fit a rather massive dark halo not detected here,
while for NGC 4486 we find a rather large extrapolated M/L also seen
in the X-ray data.
are
observed between our central M/L values and those for the luminous
component of Saglia et al. ([1992]). The M/L ratios computed at
the half-luminosity radii used by Saglia et al. ([1992]) also
agree reasonably well. However, for NGC 3379 and NGC 4374 Saglia et al.
([1992]) fit a rather massive dark halo not detected here,
while for NGC 4486 we find a rather large extrapolated M/L also seen
in the X-ray data.
For a few of our sample galaxies other data are available besides the absorption line kinematics, which considerately strengthen the evidence for dark halos in some of these galaxies. Several galaxies have velocity measurements of "discrete tracers'' (planetary nebulae, PNe; globular clusters, GC; dwarf galaxies bound to the respective galaxy, D) at intermediate to large radii; see Table 9 for a list. In these cases we performed a maximum likelihood analysis along the lines of S+2000 to test the consistency of our mass models with these data and select the most probable ones. Results are shown in Figs. 24, 25, and 27 and are discussed in the individual galaxy subsections below. Mass-profiles derived from X-ray data are still rare. S+2000 compared their models for NGC 1399 with mass-profiles derived from ASCA measurements by Ikebe et al. ([1996]). For three further galaxies of our sample, such profiles are also available: Besides the two brightest ellipticals of the Virgo-cluster, NGC 4486 and NGC 4472, for which ROSAT data were analysed by Schindler et al. ([1999]), NGC 4636 has an X-ray mass profile from ASCA-data (Matsushita et al. [1998]). For these three galaxies we compare the mass profiles of our absorption-line models to the X-ray mass profiles: NGC 4486 is shown in Fig. 28, NGC 4472 in Fig. 26 and NGC 4636 in Fig. 29. See the notes on individual galaxies below.
A number of galaxies in our sample show slight rotation, and some may be flattened and seen along special viewing directions such as to appear round on the sky. Since our modelling assumes spherical symmetry and no rotation, we need to assess the uncertainties in the results associated with these assumptions.
The most rapidly rotating galaxy in this sample is NGC 3379, which
reaches a maximum
![]() .
In the modelling
reported above, we have simply ignored v and h3. As an
alternative, we have fitted an even velocity distribution to the
spectral line shapes, forcing v=h3=0, and have then tested the
effect this has on the modelling results. In this case, the velocity
dispersions near maximum rotation are larger by about
.
In the modelling
reported above, we have simply ignored v and h3. As an
alternative, we have fitted an even velocity distribution to the
spectral line shapes, forcing v=h3=0, and have then tested the
effect this has on the modelling results. In this case, the velocity
dispersions near maximum rotation are larger by about ![]() ,
while
the h4 values become slightly more negative. From simple arguments
we would have expected an increase in
,
while
the h4 values become slightly more negative. From simple arguments
we would have expected an increase in ![]() by
by
![]() ,
i.e., about
,
i.e., about ![]() .
In these kinematics derived from
symmetrized line profiles there are significant systematic deviations
between both sides of the galaxy.
.
In these kinematics derived from
symmetrized line profiles there are significant systematic deviations
between both sides of the galaxy.
Modelling these data as before, with the same regularization
parameter, gives the following results. The anisotropy profile remains
similar. The mass scale increases slightly; in the model without
halo, the mass-to-light ratio thus increases to M/L=5.44 (previously
4.7), while the central value in the best-fit halo potential is now
M/L=5.27 (previously 4.5). In the three-integral models of Gebhardt
et al. (2000) the stellar mass-to-light ratio is in the range 4.94-5.51when corrected to B-band (using B-V=0.94 from the profiles) and to our
distance (13.2 instead of 10.4 Mpc). For NGC 3379, the uncertainty in
M/L due to the neglect of rotation is therefore ![]() .
If we
scale from these results, in the next most rapidly rotating galaxies
in the sample, with
.
If we
scale from these results, in the next most rapidly rotating galaxies
in the sample, with
![]() ,
we will
underestimate the rms velocity
,
we will
underestimate the rms velocity ![]() by
by
![]() and the
mass-to-light ratio by
and the
mass-to-light ratio by ![]() .
For
.
For
![]() the corresponding errors will be negligible.
the corresponding errors will be negligible.
| NGC | Sort |
| 1399 | 37 PN, 74 GC |
| 3379 | 29 PN |
| 4472 | 57 GC, 8 (5) D |
| 4486 | 224 GC, 8 (5) D |
| 5846 | 20 D |
We now turn to the effects of a possible flattening along the
line-of-sight. From the results of Tremblay & Merritt ([1996]),
who modelled the apparent shape distribution of a large sample of
ellipticals, we can estimate the typical intrinsic flattening of our
sample galaxies. These are bright elliptical galaxies: the large
majority falls into the highest luminosity bin of Tremblay & Merritt,
even after correcting for the difference in assumed distance. Taking
their result for a distribution of triaxial shapes with constant
triaxiality parameter
(1-b/a)/(1-c/a)=0.3, and approximating their
derived distribution of c/a in the bottom panel of their Fig. 4 by a
Gaussian, we find that the mean intrinsic short-to-long axis ratio
c/a of all luminous galaxies that project to E1 (0.9) or rounder is
0.79. (The corresponding value for the faint ellipticals with
![]() ,
assuming oblate symmetry and using Fig. 3 of Tremblay &
Merritt, would be 0.73.) The mean flattening along the line of sight
is then somewhat smaller, because not all galaxies that project to E1
or rounder have their short axes along the line-of-sight.
,
assuming oblate symmetry and using Fig. 3 of Tremblay &
Merritt, would be 0.73.) The mean flattening along the line of sight
is then somewhat smaller, because not all galaxies that project to E1
or rounder have their short axes along the line-of-sight.
If an apparently round galaxy is flattened along the line-of-sight,
this will have the following effects on our results. (i) The
line-of-sight velocity dispersion may be less than the dispersion in
the plane of the sky if the system is flattened by anisotropy, and it
will also not measure any kinetic energy corresponding to rotation
![]() in the plane of the sky. This leads to an underestimate of
the mass-to-light ratio. We can estimate the magnitude of this effect
from the tensor virial theorem, in the form
in the plane of the sky. This leads to an underestimate of
the mass-to-light ratio. We can estimate the magnitude of this effect
from the tensor virial theorem, in the form
![]() (Gerhard [1994],
Eq. 5.10). For a mean c/a=0.8 the total kinetic energy thus
increases by a factor 1.15, for constant M/L. At the same time the
flattened potential well is deeper for fixed mass and M/L; using
relations from Binney & Tremaine ([1987], Sect. 2.5) the total
potential energy increases by a factor 1.07. Since the former is
linearly proportional to M/L and the latter scales like (M/L)2,
reestablishing virial equilibrium implies an increase in M/L by about
8%. (For a galaxy with intrinsic c/a=0.6, the corresponding
value would be 21%.)
(Gerhard [1994],
Eq. 5.10). For a mean c/a=0.8 the total kinetic energy thus
increases by a factor 1.15, for constant M/L. At the same time the
flattened potential well is deeper for fixed mass and M/L; using
relations from Binney & Tremaine ([1987], Sect. 2.5) the total
potential energy increases by a factor 1.07. Since the former is
linearly proportional to M/L and the latter scales like (M/L)2,
reestablishing virial equilibrium implies an increase in M/L by about
8%. (For a galaxy with intrinsic c/a=0.6, the corresponding
value would be 21%.)
(ii) A more indirect effect is through the shape of the absorption
line profiles. This depends critically on the stellar distribution
function and hence the mechanism through which the galaxy is flattened
(see Dehnen & Gerhard [1993]). If the galaxy is flattened by
equatorial near-circular orbits, as is the case in two-integral models
f(E,Lz), then these orbits seen face-on near ![]() generate a
more peaked line profile with larger h4, which could mimic some
radial anisotropy when interpreted through a spherical model. This
effect was investigated by Dehnen & Gerhard ([1994])
and by Magorrian (2000). From Fig. 12 of Dehnen & Gerhard ([1994])
for a de Vaucouleurs-like luminosity model inside
generate a
more peaked line profile with larger h4, which could mimic some
radial anisotropy when interpreted through a spherical model. This
effect was investigated by Dehnen & Gerhard ([1994])
and by Magorrian (2000). From Fig. 12 of Dehnen & Gerhard ([1994])
for a de Vaucouleurs-like luminosity model inside
![]() ,
the increase in h4 from c/a=1 to c/a=0.8 is
,
the increase in h4 from c/a=1 to c/a=0.8 is
![]() ,
the density profile being still relatively shallow there
(d
,
the density profile being still relatively shallow there
(d ![]() d
d
![]() ). There is a simultaneous decrease in
the velocity dispersion by about 3-4%, which will cause another
upward correction of M/L. The implied
). There is a simultaneous decrease in
the velocity dispersion by about 3-4%, which will cause another
upward correction of M/L. The implied
![]() is significantly
smaller than the h4 values responsible for the radial anisotropy in
our models. In addition, because most of our galaxies are luminous
ellipticals, they are not well-described by two-integral models (e.g.,
van der Marel [1991]), and for other flattening mechanisms the
effect on the line profile shapes will be smaller.
is significantly
smaller than the h4 values responsible for the radial anisotropy in
our models. In addition, because most of our galaxies are luminous
ellipticals, they are not well-described by two-integral models (e.g.,
van der Marel [1991]), and for other flattening mechanisms the
effect on the line profile shapes will be smaller.
More significant could be the effects of hidden, sufficiently luminous
and cold face-on disks, which might lead to a larger increase in
h4. Using Fig. 1 of BSG94, we estimate that such a disk of
disk-to-bulge ratio ![]() would generate
would generate
![]() ,
as a compromise between the increased flux at zero
velocities due to the disk and the lack of effect on the large
velocity tail of the profile also measured by h4. The histogram of
disk-to-bulge ratios for the known kinematically decoupled disks or
torus-like structures (Bender & Saglia [1999]) shows that for
boxy elliptical galaxies
,
as a compromise between the increased flux at zero
velocities due to the disk and the lack of effect on the large
velocity tail of the profile also measured by h4. The histogram of
disk-to-bulge ratios for the known kinematically decoupled disks or
torus-like structures (Bender & Saglia [1999]) shows that for
boxy elliptical galaxies
![]() and for disky ellipticals
and for disky ellipticals
![]() ,
with some cases (NGC 4660) with
,
with some cases (NGC 4660) with ![]() up to
0.3. Generally these components are fairly small, extending to typical
radii
up to
0.3. Generally these components are fairly small, extending to typical
radii
![]() (Mehlert et al. [1998]). They
can be detected photometrically only if seen nearly edge-on, but might
be present in virtually all ellipticals. The three galaxies of our
sample appearing in Mehlert et al., NGC 4472, NGC 4494, NGC 7626, have
(Mehlert et al. [1998]). They
can be detected photometrically only if seen nearly edge-on, but might
be present in virtually all ellipticals. The three galaxies of our
sample appearing in Mehlert et al., NGC 4472, NGC 4494, NGC 7626, have
![]() arcsec, respectively. Therefore we conclude that the
anisotropy profiles should not suffer from the possible presence of
disks at radii
arcsec, respectively. Therefore we conclude that the
anisotropy profiles should not suffer from the possible presence of
disks at radii
![]() but might overestimate the real
anisotropy in the inner regions of the galaxies by
but might overestimate the real
anisotropy in the inner regions of the galaxies by
![]() .
.
Finally, we note that the analysis of the two flattened, non-rotating
elliptical galaxies NGC 1600 (E3.5, near edge-on) and NGC 2300 (E2,
edge-on or inclined) with three-integral models by Matthias & Gerhard
([1999]) and Kaeppeli ([1999]) resulted in similar
anisotropy profiles to those we have obtained in this paper. As a
further test, we have for these two galaxies taken the major axis
photometric profile and major axis kinematics and applied our
spherical modelling to these data, ignoring the flattening. The
resulting models slightly underestimate the radial anisotropy as
compared to the edge-on three-integral models, and the V-band M/LVcome out 5.5 and 6.5, respectively, compared to 6.0 and 6.25 in the
axisymmetric analysis, a ![]() difference.
difference.
This galaxy has a shallow luminosity profile and considerable
structure in the kinematic profiles. In the analysis the errors of the
two outermost h4 data points were set to unity to make sure that
they do not influence the fit. These points are uncertain due to low
signal-to-noise ratio. The dip in the velocity dispersion profile
together with the clustering of the data points and the substantial
scatter between the inner data points as compared to the kinematic
errors (Table 5)
make this dataset difficult to model. We
obtained more regular results with the second method of treating the
presumably systematic errors (see Sect. 4); the models
shown in Figs. 12, 18 and 20 are obtained with
this method. The ![]() confidence line is then at
confidence line is then at
![]() .
.
Our simple halo models appear to be not very well suited for this
galaxy. Together with the shallow distribution of the luminous mass
these halo potentials favour rising velocity dispersion profiles in
the outer parts when the inner data are well-fitted. There is little
evidence in the data for this. Therefore while the upper boundary of
the confidence interval appears reliable from our model results, the
lower boundary should probably include models with a flat velocity
curve with
![]() .
Nonetheless, the self-consistent
model falls short of fitting the data from about 40''.
.
Nonetheless, the self-consistent
model falls short of fitting the data from about 40''.
This galaxy is modelled in detail by S+2000. As described there the line-of-sight velocities of 37 PNe from Arnaboldi et al. ([1994]) and 74 GCs from Kissler-Patig et al. ([1998]) favour the high-mass halo models in Fig. 18. These are also consistent with X-ray mass profiles from Ikebe et al. ([1996]). The abrupt increase of the dispersion profile seen in the PNe and GCs just beyond the end of the absorption line data needs to be confirmed with larger PNe samples.
Since the absorption line data only weakly imply dark matter in this
galaxy, we have used NGC 1399 to show that the details of how
to determine the ![]() confidence line do not significantly influence
the result; see Sect. 4 and Fig. 22.
confidence line do not significantly influence
the result; see Sect. 4 and Fig. 22.
Finally we have used this galaxy to check that within the
uncertainties the derived kinematic properties are independent of the
choice of basis functions employed in the modelling. The long dashed
- dotted lines in the panel for NGC 1399 in Fig. 12 show the
fit to the kinematic data using a distribution function composed from
a basis of 39 radially anisotropic plus the isotropic basis functions
in the same best-fit halo potential as for the full line with the
basis used in S+2000, which contained 55 tangentially anisotropic, one
radially anisotropic, and the isotropic models. Notice the close
similarity of these two models in both the velocity dispersion and
h4 profiles, although the new model has a significantly higher
![]() .
Both models also agree in the shape of the derived
anisotropy profile, showing a similar radially anisotropy main body
between 5''-50'' and turning towards a more isotropic structure both
in the centre and in the outer parts. The most significant difference
is the slightly lower maximum anisotropy resulting with the radial
basis. This agreement in the inherently less accurate intrinsic
quantity
.
Both models also agree in the shape of the derived
anisotropy profile, showing a similar radially anisotropy main body
between 5''-50'' and turning towards a more isotropic structure both
in the centre and in the outer parts. The most significant difference
is the slightly lower maximum anisotropy resulting with the radial
basis. This agreement in the inherently less accurate intrinsic
quantity ![]() is gratifying.
is gratifying.
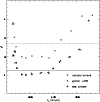 |
Figure: 22
|
NGC 2434 was modelled extensively by Rix et al. ([1997]) with a modified
Schwarzschild method. We have used the same photometric and kinematic
data from Carollo & Danziger ([1994]), but have ignored the kinematic
data inside R < 1 arcsec for the fit. The steep increase in ![]() and the relatively high values of h4 may indicate a central dark
mass.
and the relatively high values of h4 may indicate a central dark
mass.
The results for this galaxy allow a direct comparison of both
methods. In both analyses the SC models are ruled out by a large
margin in ![]() .
Also, the circular velocity curves of the
respective best models are very similar (see Figs. 13 and
8 of Rix et al. [1997]). Our value of the central
.
Also, the circular velocity curves of the
respective best models are very similar (see Figs. 13 and
8 of Rix et al. [1997]). Our value of the central
![]() = 6.00
= 6.00 ![]() 0.3 whereas Rix et al. obtained
0.3 whereas Rix et al. obtained
![]() =
=
![]() 3.9
3.9 ![]() 0.35, probably because their different halo models
contributed more dark mass near the center. Our "best'' value for the
circular velocity at the outermost kinematic data point (
0.35, probably because their different halo models
contributed more dark mass near the center. Our "best'' value for the
circular velocity at the outermost kinematic data point (
![]() at
62'') agrees well with their best-fitting models. Another difference
concerns the intrinsic velocity anisotropy. Rix et al. found an almost
constant anisotropy of
at
62'') agrees well with their best-fitting models. Another difference
concerns the intrinsic velocity anisotropy. Rix et al. found an almost
constant anisotropy of
![]() which is slightly more than
our maximum value at
which is slightly more than
our maximum value at ![]() 0.5
0.5 ![]() .
Outwards of 10 arcsec our
anisotropy falls, reaching a value of zero at 40 arcsec (roughly 2
.
Outwards of 10 arcsec our
anisotropy falls, reaching a value of zero at 40 arcsec (roughly 2
![]() )
from whereon outwards it is consistent with
isotropic. Comparing both figures suggests that Rix et al. may slightly
overestimate the outer anisotropy while our model may slightly
underestimate it; so both results may not be inconsistent, emphasizing
the larger uncertainties in any derived intrinsic quantities.
)
from whereon outwards it is consistent with
isotropic. Comparing both figures suggests that Rix et al. may slightly
overestimate the outer anisotropy while our model may slightly
underestimate it; so both results may not be inconsistent, emphasizing
the larger uncertainties in any derived intrinsic quantities.
For this galaxy we have additional data available and have used these to do two additional tests. The first relates to the possible influence of a color gradient (0.3 mag measured between 2 arcsec and 120 arcsec), the existence of which implies that the luminous mass distributions based on the B-band surface brightness profile will be slightly different from that based on the R-band profile. To see how much this changes the dynamical models and the inferred circular velocity curves we have done the analysis separately for both bands. Therefore Figs. 10, 12, 18 and 20 each contain two panels for NGC 3379, referring to the B-Band and R-band models, respectively. From these plots it can be seen that the implied differences in the fits to the kinematic data, the intrinsic velocity anisotropy, and the circular velocity curves are small.
Secondly, independent kinematic data along four slit directions are
available from Statler & Smecker-Hane ([1999]). The corresponding
velocity dispersion and h4 profiles differ slightly from
each other, possibly indicating a weakly triaxial shape of the
galaxy. To see how this might influence our model results, we have
done the analysis independently for all of these position
angles. Figure 23 shows the four fits to their data in
comparison with the fit derived earlier for the data shown in Sect. 2.
The data taken from Statler & Smecker-Hane ([1999]) have larger
error bars and can be fitted with smaller ![]() than our data,
which result in
than our data,
which result in
![]() due to large point-to-point
variations. Nonetheless all models for the five data sets show good
agreement in the fits to
due to large point-to-point
variations. Nonetheless all models for the five data sets show good
agreement in the fits to ![]() and h4, and even in the more
sensitive intrinsic anisotropy parameter
and h4, and even in the more
sensitive intrinsic anisotropy parameter ![]() the differences are
only
the differences are
only
![]() .
The resulting cumulative mass and M/L curves
agree to better than five percent.
.
The resulting cumulative mass and M/L curves
agree to better than five percent.
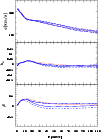 |
Figure 23:
Comparison of the best-fit models for NGC 3379 obtained
from our data (solid line) and that from Statler & Smecker-Hane ([1999])
along several slits (dotted, dashed, dot-dashed and long-dashed lines
for major axis, minor axis, PA = 25, and PA = 115, respectively).
Top panel: Velocity dispersion versus radius.
Middle panel: h4 profile.
Bottom panel: the inferred velocity anisotropy |
In addition, radial velocity measurements for 29 PNe are available for
NGC 3379 (Ciardullo et al. [1993]). The maximum likelihood analysis
(using the B-band models) shows that the SC model is consistent with
the data as already noted by Ciardullo et al. ([1993]). However,
since the PNe sample is very small
the likelihood analysis does not constrain the range of the
valid models strongly. Thus models with circular velocities in the
range of 240 km s-1 to 350 km s-1 are within the ![]() confidence
interval; see Fig. 24.
confidence
interval; see Fig. 24.
 |
Figure 24: The 29 PN of NGC 3379 binned (triangles) and plotted with the absorption line data (filled squares). The same three models as in Fig. 12 are plotted |
NGC 6703 was analysed by G+98 as a prototype for the
analysis method used here. They made the simplifying assumption of
using a Jaffe-model for the photometry, with
![]() arcsec and
arcsec and
![]() ,
and employed a
set of 20 basis functions in the analysis. They found that potentials
with
,
and employed a
set of 20 basis functions in the analysis. They found that potentials
with
![]() km s-1 at the outermost kinematic data point
fitted the data well in a
km s-1 at the outermost kinematic data point
fitted the data well in a ![]() -sense and the SC-model was ruled
out by a large margin. We redid the analysis using the same kinematic
data, but inverting the SB-profile as described in Sect.
4 and using the extended basis set of 59 DFs as for the
other galaxies of the present sample. The new results are shown in
Figs. 10, 12, 18 and 20 and
supersede those of G+98.
-sense and the SC-model was ruled
out by a large margin. We redid the analysis using the same kinematic
data, but inverting the SB-profile as described in Sect.
4 and using the extended basis set of 59 DFs as for the
other galaxies of the present sample. The new results are shown in
Figs. 10, 12, 18 and 20 and
supersede those of G+98.
Comparison with the older results shows the following. The agreement
of the deprojected density profile with the Jaffe profile is very good
except for the very inner parts and a few small bumps round ![]() also
seen in the SB profile. Nevertheless the new models employing the
extended basis tend to favor smaller
also
seen in the SB profile. Nevertheless the new models employing the
extended basis tend to favor smaller ![]() by 20-30 km s-1, and the SC
model, although near the lower boundary of the confidence intervall,
fits the data well in a
by 20-30 km s-1, and the SC
model, although near the lower boundary of the confidence intervall,
fits the data well in a ![]() sense, even though it still lies
below many of the h4 data points at intermediate radii. To test
the origin of this difference we have also computed models with the
new basis and smoothing parameter
sense, even though it still lies
below many of the h4 data points at intermediate radii. To test
the origin of this difference we have also computed models with the
new basis and smoothing parameter ![]() but for the old Jaffe
density profile. This showed that the greater part of the change is
due to the larger basis used here. Apparently the smaller basis still
implied residual smoothing through the basis functions, which is not
negligible given the significant amount of substructure seen in the
NGC 6703 kinematic profiles (in particular, the sharp dip in h4near 5'', and the structure near 30'' in
but for the old Jaffe
density profile. This showed that the greater part of the change is
due to the larger basis used here. Apparently the smaller basis still
implied residual smoothing through the basis functions, which is not
negligible given the significant amount of substructure seen in the
NGC 6703 kinematic profiles (in particular, the sharp dip in h4near 5'', and the structure near 30'' in ![]() ), and thus
influences the
), and thus
influences the ![]() -analysis. The model profiles on which the
tests of G+98 were carried out, and many of the other galaxies
analysed here do not have such sharp substructures. The shape of the
circular velocity curve, the anisotropy profile, and the stellar
mass-to-light ratio are not strongly affected (note that the value
given in Table 7 is for a different distance than the values
given by G+98).
-analysis. The model profiles on which the
tests of G+98 were carried out, and many of the other galaxies
analysed here do not have such sharp substructures. The shape of the
circular velocity curve, the anisotropy profile, and the stellar
mass-to-light ratio are not strongly affected (note that the value
given in Table 7 is for a different distance than the values
given by G+98).
The drop in the velocity dispersion inside of R = 10 arcsec possibly indicates the presence of central disk seen face-on. Although it is possible to produce a satisfying fit to the kinematics, the resulting rise in M/L could be due not to the dark matter halo but to the transition from the disk-dominated to a random motion-dominated region.
For this galaxy we again used both methods described in Sect.
4 for deriving ![]() values when the scatter
in the data exceeds the observational
errors. The results from the second method were marginally better than
those obtained with globally increasing the error bars, and they are
therefore shown in the figures.
values when the scatter
in the data exceeds the observational
errors. The results from the second method were marginally better than
those obtained with globally increasing the error bars, and they are
therefore shown in the figures.
The BSG data for this galaxy have two very high velocity dispersion
points with large errors on one side of the galaxy at
![]() .
For the modelling we have assumed that there is some problem with
these points, and have used only the data points on the other side
with significantly lower dispersions and smaller errors.
.
For the modelling we have assumed that there is some problem with
these points, and have used only the data points on the other side
with significantly lower dispersions and smaller errors.
The outermost pairs of points for ![]() and h4 in the original
data deviate from each other by much more than their error bars. Thus the
errors of these points were replaced by one half the separation (see
Fig. 15). Even afterwards the fits yield values of
and h4 in the original
data deviate from each other by much more than their error bars. Thus the
errors of these points were replaced by one half the separation (see
Fig. 15). Even afterwards the fits yield values of ![]() larger than unity (
larger than unity (
![]() for the best fitting model). Thus
the confidence interval was determined by increasing the errors by
for the best fitting model). Thus
the confidence interval was determined by increasing the errors by
![]() .
.
For this galaxy, Bertola et al. ([1993]) estimated the mass-to-light
ratio from the kinematics of an extended gas ring. Converted to the
distance used in the present paper, they found values for the
![]() of 2.9 at 0.5
of 2.9 at 0.5 ![]() and 33 at 10
and 33 at 10 ![]() .
The corresponding values at
these radii of our "best'' model are 9.6 and 19.4, respectively, i.e.,
our profile is less steep than theirs.
.
The corresponding values at
these radii of our "best'' model are 9.6 and 19.4, respectively, i.e.,
our profile is less steep than theirs.
We used the major axis data for the fit. BSG show data points out to
43''. From the spectra, two further velocity dispersion points on both
sides of the nucleus could be obtained, extending the profile to
![]() .
However, it was not possible to derive corresponding
h4 values. The data points within R < 3 arcsec were not fitted.
The increase of
.
However, it was not possible to derive corresponding
h4 values. The data points within R < 3 arcsec were not fitted.
The increase of ![]() and h4 towards the center may be the
kinematic signature of a central dark mass.
and h4 towards the center may be the
kinematic signature of a central dark mass.
Sharples et al. ([1998]) provide a list of 57 GC velocities for NGC 4472.
The maximum likelihood analysis result is that the GC-data allow a
range of
![]() km s-1 and thus do not constrain the
potentials as strongly as the absorption-line data do, again because
of the small number of velocities. To compare the data "by eye''
with our models we calculated the GC velocity dispersion for 5 bins
containing 10 and 17 GCs. The same was done for 8 satellite galaxies
of NGC 4472 taken from Binggeli ([1993]) of which 5 are believed to be
"real'' and 3 "possible'' satellites. Figure 25 shows
the combined velocity dispersion data together with "best'' and
boundary models for the absorption line data. The dispersion for the
satellite galaxies should be considered as an upper limit. A model
with a somewhat less massive halo than included in the "best'' model,
but well within the allowed range, would fit the combined data well.
km s-1 and thus do not constrain the
potentials as strongly as the absorption-line data do, again because
of the small number of velocities. To compare the data "by eye''
with our models we calculated the GC velocity dispersion for 5 bins
containing 10 and 17 GCs. The same was done for 8 satellite galaxies
of NGC 4472 taken from Binggeli ([1993]) of which 5 are believed to be
"real'' and 3 "possible'' satellites. Figure 25 shows
the combined velocity dispersion data together with "best'' and
boundary models for the absorption line data. The dispersion for the
satellite galaxies should be considered as an upper limit. A model
with a somewhat less massive halo than included in the "best'' model,
but well within the allowed range, would fit the combined data well.
In Fig. 26 we plot the X-ray mass-profile from Schindler et al. ([1999]) over our models. The "best'' model from the absorption line kinematics provides a very good match to the X-ray mass profile at large radii. Here, the significant result is the agreement in the normalisation. The functional form assumed for our halo models implies an outer mass profile linearly increasing with the radial distance. In the case of NGC 4472 (but see NGC 1399, S+2000, and NGC 4636 below) this is similar to the radial profile derived from the X-ray emission under the assumption of isothermality.
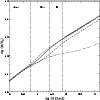 |
Figure 26: Mass profiles for NGC 4472 derived from ROSAT X-ray measurements for an isothermal gas (long dashed-dotted curve) compared to the models plotted in Figs. 25 and 16. The solid line is again the "best'' model and provides a very good match to the X-ray mass profile at large radii. The dotted line is the constant mass-to-light model. The vertical line to the right of "stars'' denotes the outer boundary of the stellar absorption line data, the one to the right of "GCs'' the corresponding limit of the globular cluster data, and the line next to the "D'' marks the mean position of the dwarf galaxies |
For NGC 4486 there is a large sample of GC velocities compiled by
Cohen & Ryzhov ([1997]) and Cohen ([1999]), containing 224 clusters.
The maximum likelihood analysis for this sample shows that a range of
potentials corresponding to a circular velocity between 490 km s-1 and
600 km s-1 at R = 42 arcsec, the outermost stellar-kinematic data point,
is consistent with the GC velocity data. As noted by
Kissler-Patig & Gebhardt ([1998]) the outer GCs of NGC 4486 show
considerable rotation (
![]() versus
versus
![]() for
the outermost bin with R > 400 arcsec). At smaller radii,
for
the outermost bin with R > 400 arcsec). At smaller radii,
![]() ,
however. If we exclude the GCs outside 400 arcsec, the
range of valid potentials is narrowed to 490 - 570 km s-1.
,
however. If we exclude the GCs outside 400 arcsec, the
range of valid potentials is narrowed to 490 - 570 km s-1.
As for NGC 4472 we binned the data and calculated the velocity dispersion (bin-size 20, 24 for the outermost bin) for the GCs and for 8 satellite galaxies from Binggeli ([1993]). Also in this case 5 of the galaxies are bound to NGC 4486 and 3 are uncertain; thus the dispersion point for the galaxies is again an upper limit. In Fig. 27 we show the combined data together with the models derived from the stellar kinematic data. The data points fit perfectly into the confidence interval. Note that the SC model fails to match the GC data whereas it is within the confidence interval set by the absorption-line data.
In Fig. 28 we plot the X-ray mass-profile from Schindler et al. (1999) over our models. Their profile was calculated under the assumption of an isothermal gas distribution. The "best'' model from the absorption line kinematics provides a very good match to the X-ray mass profile at large radii. Like in NGC 4472 the significant part of this good match is the agreement in the normalisation.
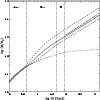 |
Figure 28: Mass profiles for NGC 4486 derived from ROSAT X-ray measurements for an isothermal gas (long dashed-dotted curve) compared to the models plotted in Figs. 27 and 16. The solid line is again the "best'' model and provides a very good match to the X-ray mass profile at large radii. The dotted line is the constant mass-to-light model. The vertical lines have the same meaning as in Fig. 26 |
For this galaxy we combined the major and minor axis data of BSG94. The errors for the pairs of velocity dispersion data points at 2 and 3.5 arcsec were set to one-half their respective separations. The reconstructed model DFs have large rms deviations indicating that the models constructed for this galaxy are the least reliable in the sample.
Using the value of the smoothing parameter determined by MC
simulations results in
![]() .
The main contribution to
this large
.
The main contribution to
this large ![]() stems from the large point-to-point variations in
stems from the large point-to-point variations in
![]() between 5 and 10 arcsec, compared to the quoted
errors. Increasing the errors by
between 5 and 10 arcsec, compared to the quoted
errors. Increasing the errors by ![]() allows the estimation of a
confidence interval.
allows the estimation of a
confidence interval.
The kinematic data have rather large errors. Both of the h4 data points at 32 arcsec are probably spurious. Thus their errors were set to unity to ensure they do not influence the fit.
For NGC 4636 mass-profiles derived from ASCA X-ray data are available from Matsushita et al. ([1998]). Even in this case where the stellar kinematical models are not as extended and not as reliable as for the previous two galaxies with X-ray data, the agreement is still reasonably good.
Copyright The European Southern Observatory (ESO)