0235-197 appears to be dominated by the outer lobes at frequencies
> 5 GHz. The most interesting feature is the bright hot spot at the
far end of the Eastern lobe. At both 5 and 8.4 GHz (Figs.1 to 3), the hot
spot has a double structure with individual components labelled E1
and E2. Component E1 also appears double when
observed with higher resolution at 15GHz (Fig.4). The images have
been convolved to 0.4 arcsec resolution in order to calculate the hot spot
spectral indices. Both components E1 and E2 show a
large steepening in spectral index, ![]() (
(
![]() ),
between 5-8.4GHz and 8.4-15GHz. We find values of
),
between 5-8.4GHz and 8.4-15GHz. We find values of
![]() and
and
![]() respectively for E1 and
respectively for E1 and
![]() and
and
![]() respectively for E2. The front shock of the
lobe W1 at the opposite side is resolved in all of the images
and can hardly be defined as a "hot spot''. The spectral index of the
bright part at the far end is also steep (
respectively for E2. The front shock of the
lobe W1 at the opposite side is resolved in all of the images
and can hardly be defined as a "hot spot''. The spectral index of the
bright part at the far end is also steep (
![]() )
in the
range 5-8.4 GHz and it steepens to
)
in the
range 5-8.4 GHz and it steepens to
![]() in the range 8.4-15 GHz
(since the 15 GHz flux density estimate is an upper limit).
Note that the observations at 15 GHz have lower sensitivity to
diffuse, extended emission.
in the range 8.4-15 GHz
(since the 15 GHz flux density estimate is an upper limit).
Note that the observations at 15 GHz have lower sensitivity to
diffuse, extended emission.
 |
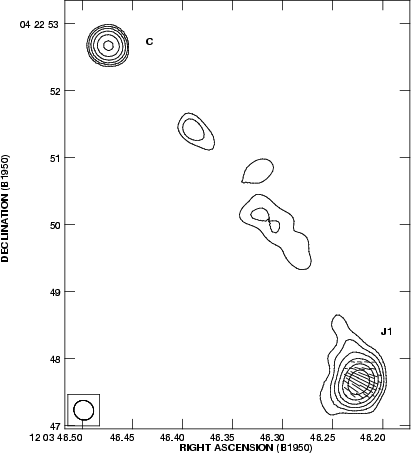
Figure 7: VLA image of 1203+043 at 8.4 GHz. Contours are at -0.25, 0.25, 0.5, 1, 2, 4, 8, 16, 32, 64, 128 mJybeam-1. The peak flux density is 14.8 mJybeam-1 |
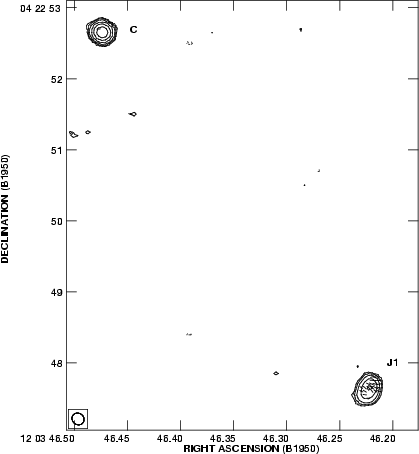 |
Figure 9:
VLA image of 1203+043 at 15 GHz.
Contours
are at -0.4, 0.4, 0.6, 1, 2, 4, 8, 16, 32 mJybeam-1.
The peak flux density is 14.5 mJybeam-1.
A vector length of 1
|
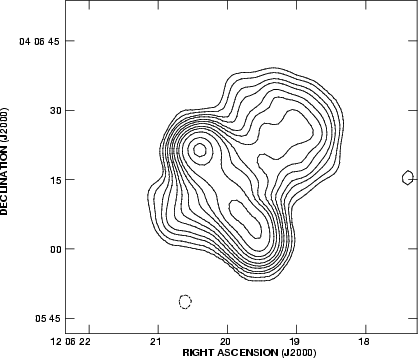 |
Figure 10: VLA image of 1203+043 at 320 MHz. Contours are at -5, 5, 10, 20, 30, 50, 70, 100, 150, 200, 300, 500, 700, 800 mJybeam-1. The peak flux density is 796 mJybeam-1 |
| Source | z | C | PA | RM | RM |
DP | DP | |||||
| 6 cm | 4 cm | 2 cm | (1+ z)2 | 6 cm | 4 cm | 2 cm | 6-4 | 4-2 | ||||
0235-197 |
0.62 | E1 | 68 |
77 |
84 |
87 | 228 | 22.0 | 23.6 | 20.2 | 0.93 | 1.2 |
| E2 | -80 |
-84 |
82 |
-87 | -228 | 13.4 | 17.8 | 8.4 | 0.75 | 2.1 | ||
| W1 | 78 |
83 |
- | 35 | 92 | 22.8 | 19.5 | - | 1.20 | - | ||
1203+043 |
J1 | 68 |
62 |
66 |
17 | 15.0 | 20.2 | 5.5 | 0.74 | 3.7 | ||
| J2 | -68 |
-49 |
- | 140 | 15.8 | 10.9 | - | 1.45 | - |
All of the hot spots are highly polarized, with little depolarization
and Faraday rotation. The magnetic field is parallel to the
front shock and rather ordered in the lobe regions with weak diffuse
emission. (The electric vector is shown in all of the images shown in
the paper). At 320 MHz (Fig.5), the polarized emission, if any,
is below the detection limit of our observations.
Polarized emission is detected over all of the source
in the low resolution observations at 5 GHz (Fig.6). The magnetic
field is again ordered and, generally speaking, parallel to the source
major axis, apart from the hot spot area, where the magnetic field is
parallel to the front shock. There are two main regions of polarized
emission in the E lobe. The mean PA given in Table 5 should be treated
with care because the position angles of the polarization
vectors in the lobe actually vary greatly. The depolarization
between 5 GHz and 320 MHz is very high (DP>0.02). Statistically, in these
classical sources, the lobe nearest to the nucleus usually shows a
steeper spectral index. Here we find similar values
(![]() 0.84) for the two lobes of 0235-197. There are
indications of Faraday rotation in the hot spots from the high
resolution maps.
0.84) for the two lobes of 0235-197. There are
indications of Faraday rotation in the hot spots from the high
resolution maps.
However, the new observations have allowed us to identify component
C with the core of the radio source. This component has an
inverted spectrum which peaks at frequencies ![]() 15 GHz.
1203+043 therefore has an asymmetric structure, with a long bent jet
pointing South which fades slowly and with a weak lobe of emission to
the north where there is marginal evidence of an hot spot.
The radio position of the core of 1203+043 does not coincide within the
errors to any optical counterpart on the Palomar Sky Survey prints.
15 GHz.
1203+043 therefore has an asymmetric structure, with a long bent jet
pointing South which fades slowly and with a weak lobe of emission to
the north where there is marginal evidence of an hot spot.
The radio position of the core of 1203+043 does not coincide within the
errors to any optical counterpart on the Palomar Sky Survey prints.
Much more interesting is the structure found
at 320 MHz (Fig.10). Together with the North-South structure which
dominates at higher frequencies and which appears here as a ridge of
emission, there is a region of diffuse emission with its major axis
perpendicular to the main ridge. This new feature is about 50 arcsec
in extent and is comparable in width with the main
North-South ridge.
| Source | C | PA | |
0235-197 |
E | -16 |
10.5 |
| C | -85 |
9.1 | |
| W | -18 |
20.6 |
Copyright The European Southern Observatory (ESO)