Figure 5 demonstrates that the present survey has added a number of
gas-rich galaxies to samples both within the Local Supercluster
(
![]() km s-1)
and beyond it.
It is no surprise that late-type, pure disk galaxies are generally
gas-rich systems, readily detectable in H I.
However, the high detection rate of our survey and of
the Giovanelli et al. (1997)
FGC survey underscore the important fact
that late-type, pure disk galaxies are abundant in the nearby
universe, and hence represent one of the most common products of
galaxy disk formation (see also van der Kruit 1987). Furthermore,
since our current survey has explored only nearly edge-on systems,
numerous additional examples of analogous galaxies
are certain to exist among samples of
recently-catalogued extreme late-type and
low surface brightness galaxies seen at lower
inclinations (see also
Dalcanton & Schectman 1996; Matthews & Gallagher 1997).
Even if their overall contribution to the mass and
luminosity density of the universe is small, late-type, pure disk galaxies are
not negligible in terms of number counts. Any model of galaxy disk
formation and evolution must therefore account for the abundance
and properties of these small disks, as well as their survival into
the present epoch.
km s-1)
and beyond it.
It is no surprise that late-type, pure disk galaxies are generally
gas-rich systems, readily detectable in H I.
However, the high detection rate of our survey and of
the Giovanelli et al. (1997)
FGC survey underscore the important fact
that late-type, pure disk galaxies are abundant in the nearby
universe, and hence represent one of the most common products of
galaxy disk formation (see also van der Kruit 1987). Furthermore,
since our current survey has explored only nearly edge-on systems,
numerous additional examples of analogous galaxies
are certain to exist among samples of
recently-catalogued extreme late-type and
low surface brightness galaxies seen at lower
inclinations (see also
Dalcanton & Schectman 1996; Matthews & Gallagher 1997).
Even if their overall contribution to the mass and
luminosity density of the universe is small, late-type, pure disk galaxies are
not negligible in terms of number counts. Any model of galaxy disk
formation and evolution must therefore account for the abundance
and properties of these small disks, as well as their survival into
the present epoch.
Table 4 summarizes the range of Hubble types covered in the present survey, and the detection rates for each type. In contrast to the FGC survey of Giovanelli et al. (1997), our survey concentrated on FGC and related galaxies with Hubble types later than Scd, hence we observed relatively few Sc and earlier spirals. Nonetheless, even given the small numbers of statistics, we note a sharp falloff in the detection rate of Sc targets compared with Scd and later systems. This may be partly due to the fact that most Sc targets in our survey were at low declinations (where sensitivity is reduced due to higher system temperatures), and partly due to the fact that previously undetected Sc spirals are rarer within our search range than new examples of smaller and fainter disk systems.
 |
Figure 5: Histogram showing the number of galaxies detected in the present survey as a function of heliocentric radial velocity, in km s-1 |
An examination of Fig. 2 reveals that the spectra of the galaxies we have
detected most often exhibit the classic double-peaked rotational
profiles expected for late-type, rotationally-supported
disk galaxies seen near edge-on.
Very few of the galaxies in the present survey were
resolved significantly by
the telescope beam; therefore subject to signal-to-noise limitations, our
spectra should
be accurate representations of the globally averaged
rotation profiles of the H I disks of these galaxies.
| |
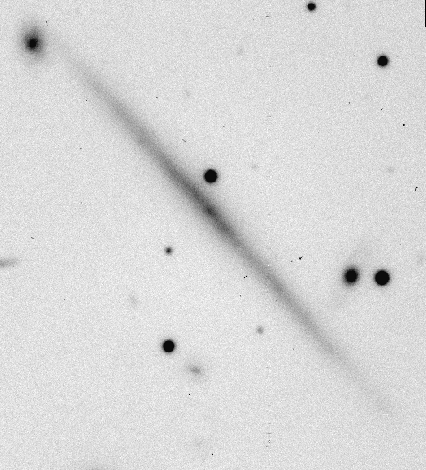
Figure 6:
An R-band CCD image of FGC 175 obtained with the WIYN
telescope. The exposure time was 750 s and seeing was |
 |
Figure 7:
An R-band CCD image of UGC 825 obtained with the WIYN
telescope. The exposure time was 750 s, and seeing was |
Since in some cases,
optical classifications of edge-on, pure disk spirals
can be difficult from images on survey plates alone,
the H I profile type can serve as an additional
check.
In most
cases, we find that the H I profile type correlates reasonably well
with the optical Hubble
classification of the object. For example,
the profiles of the Sd and earlier galaxies
typically exhibit more well-defined rotation horns than the Sdm and
later systems, and the more luminous Sd systems with visible dust
lanes tend to have broader rotation profiles than the more diffuse Sd
objects. To illustrate this point, in
Figs. 6, 7 and 8
we show optical R-band CCD images of 3 galaxies from the
present sample. These images were obtained with the WIYN![]() telescope at Kitt Peak. FGC 175
(Fig. 6) is an Sdm galaxy; UGC 825
(Fig. 7) is a fairly bright Sd with a prominent dust
lane; and FGC 2366 (Fig. 8) is a moderate surface
brightness Sd with no obvious dust lane, only a modest central light
concentration, and with the highest
catalogued axial
ratio of all the galaxies in the present survey (a/b=21.6).
The optical morphologies of these galaxies may be compared with the
corresponding global H I profiles in Fig. 2.
telescope at Kitt Peak. FGC 175
(Fig. 6) is an Sdm galaxy; UGC 825
(Fig. 7) is a fairly bright Sd with a prominent dust
lane; and FGC 2366 (Fig. 8) is a moderate surface
brightness Sd with no obvious dust lane, only a modest central light
concentration, and with the highest
catalogued axial
ratio of all the galaxies in the present survey (a/b=21.6).
The optical morphologies of these galaxies may be compared with the
corresponding global H I profiles in Fig. 2.
 |
Figure 9: Histogram showing the distribution of linewidths (in km s-1) for the galaxies detected in the present survey. The linewidths shown were measured at 20% peak maximum and corrected for spectral resolution and cosmological effects, as described in Sect. 4.1 |
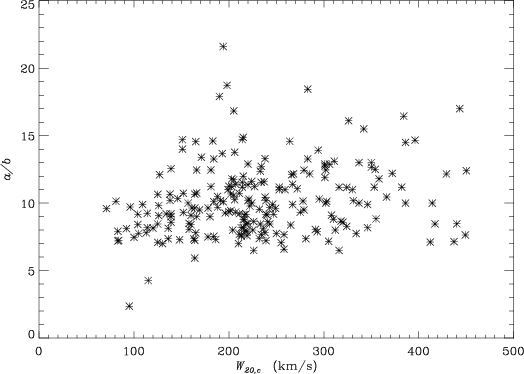 |
Figure 10: The distribution of H I linewidths (in km s-1) from the present survey as a function of apparent axial ratio. The linewidths were measured at 20% peak maximum and corrected for spectral resolution and cosmological effects, as described in Sect. 4.1 |
 |
Figure 11: The same as in Fig. 10, but with data from Giovanelli et al. (1997) overplotted as diamonds, and with five additional superthin galaxies from the literature overplotted as filled circles (see Text). In order to be commensurate with the range of linewidths covered in the present survey, only datapoints with W20<500 km s-1 are shown from the Giovanelli et al. sample |
In spite of some general trends, within the broad categories of H I profile types we nonetheless still see a fair amount of diversity even for a give Hubble type (see Fig. 2). This suggests that the H I properties of late-type, pure disk systems do show variations, hence one needs to be cautious in too widely generalizing their properties before more detailed investigations of a significant number of the individual objects have been undertaken.
The observed range of linewidths is as expected
for the Hubble types covered in the present survey, and we see a strong
peak in the range
![]() km s-1. For the Sd component of our
sample, the mean corrected W20 is 244 km s-1, and the median is
234 km s-1; for the Sdms, the mean is 197 km s-1 and the median is
202 km s-1. Using the Nearby Galaxies Catalog (TNGC) of Tully (1988), we
compare these averages to other nearby, late-type spirals.
For the 75 Sd (T=7) galaxies in the TNGC
with
km s-1. For the Sd component of our
sample, the mean corrected W20 is 244 km s-1, and the median is
234 km s-1; for the Sdms, the mean is 197 km s-1 and the median is
202 km s-1. Using the Nearby Galaxies Catalog (TNGC) of Tully (1988), we
compare these averages to other nearby, late-type spirals.
For the 75 Sd (T=7) galaxies in the TNGC
with
![]() ,
we find a mean
inclination-corrected W20 value of 235 km s-1 and a median of
238 km s-1. For the 79 Sdm (T=9) galaxies in the TNGC
with
,
we find a mean
inclination-corrected W20 value of 235 km s-1 and a median of
238 km s-1. For the 79 Sdm (T=9) galaxies in the TNGC
with
![]() ,
we find a mean W20,i of
221 km s-1 and a median of 213 km s-1. We thus find no significant
offsets if the rotational velocities of our sample of highly flattened Sd
systems compared with other Sds. There is some hint that the
Sdms in our present
sample
rotate slightly more slowly on average than the TNGC sample; this
slight difference may be
partly a consequence of our new sample containing larger numbers of less
luminous Sdm systems than the TNGC.
,
we find a mean W20,i of
221 km s-1 and a median of 213 km s-1. We thus find no significant
offsets if the rotational velocities of our sample of highly flattened Sd
systems compared with other Sds. There is some hint that the
Sdms in our present
sample
rotate slightly more slowly on average than the TNGC sample; this
slight difference may be
partly a consequence of our new sample containing larger numbers of less
luminous Sdm systems than the TNGC.
Figures 10-11
demonstrate that a wide spread is seen among the
![]() values for the less highly
flattened galaxies (a/b<10)
in the samples illustrated. This is expected, since
pure disk systems with a/b<10 will include a mixture of both
"superthin'' galaxies viewed several degrees away from edge-on, as well as
edge-on, intrinsically thicker systems.
values for the less highly
flattened galaxies (a/b<10)
in the samples illustrated. This is expected, since
pure disk systems with a/b<10 will include a mixture of both
"superthin'' galaxies viewed several degrees away from edge-on, as well as
edge-on, intrinsically thicker systems.
Of perhaps greater interest are the
"extreme'' superthin galaxies in the sample (i.e., those with ![]() ). We note that no such galaxies were found with
W20 <
). We note that no such galaxies were found with
W20 <![]() 190 km s-1, suggesting that perhaps there exists some minimum
rotational velocity (or equivalently, mass)
below which such systems cannot exist (see also Karachentsev 1999).
Moreover, there appears to be a steep
rise in the maximum permitted axial ratio for disks between
190 km s-1, suggesting that perhaps there exists some minimum
rotational velocity (or equivalently, mass)
below which such systems cannot exist (see also Karachentsev 1999).
Moreover, there appears to be a steep
rise in the maximum permitted axial ratio for disks between
![]() 100 km s-1 and
100 km s-1 and
![]() 200 km s-1.
200 km s-1.
In the combined sample of
Figs. 11, 7 of the 27 galaxies with ![]() fall in the narrow
interval
fall in the narrow
interval
![]() km s-1, including the most extreme
object in the sample, FGC 2366, with a/b=21.6 (see
Fig. 8). Figures 10 and
11 also
show a high density of objects with
km s-1, including the most extreme
object in the sample, FGC 2366, with a/b=21.6 (see
Fig. 8). Figures 10 and
11 also
show a high density of objects with ![]() in the interval and
in the interval and
![]() km s-1, while for a/b>15, this range of rotational
velocities is
unpopulated. Although we still have only a small number of statistics
for galaxies with
km s-1, while for a/b>15, this range of rotational
velocities is
unpopulated. Although we still have only a small number of statistics
for galaxies with ![]() the combination of these trends raises
the interesting
possibility that there may be certain mass ranges over which
the most extreme
superthin disks are most likely to form, or to retain their svelte
appearances (see also Matthews et al. 2000a).
the combination of these trends raises
the interesting
possibility that there may be certain mass ranges over which
the most extreme
superthin disks are most likely to form, or to retain their svelte
appearances (see also Matthews et al. 2000a).
It has been proposed that many flattened, pure disks galaxies, particularly those "superthin'' objects with a/b>10, must necessarily have remained largely unperturbed in order to preserve their thin, bulgeless, dynamically cold stellar disks (e.g., Reshetnikov & Combes 1997; Matthews 1998). The redshifts obtained in the present survey (together with those of Giovanelli et al. 1997), can be used to test this proposition by exploring the environments of these galaxies for the first time in three dimensions. A detailed examination of this problem is deferred to a later paper, but here we remark on a few trends.
In our present survey we find that among the 232 targets detected with a
moderately high level of certainty (i.e. those listed in Table 1),
incidences of true blended or
confused H I profiles are relatively rare, in spite of the rather large beam
sizes of the Nançay and Green Bank 140-ft telescopes (
![]() and 21' FWHP, respectively). In only 10 cases were we able to
identify a neighbor within 1.5 beam diameters of the target and having
a similar redshift (
and 21' FWHP, respectively). In only 10 cases were we able to
identify a neighbor within 1.5 beam diameters of the target and having
a similar redshift (
![]() km s-1). These cases are
described individually in more detail in Appendix A.
In six of these instances, the target object is not a superthin, i.e.,
a/b<10. The four exceptions to this are FGC 1845 (a/b=13.3),
UGC 11243 (a/b=11.2), FGC 2264 (a/b=14.3), and ESO 467-063
(a/b=12.4). Although the thinness of the disks of these objects in
the presence of a neighbor within a projected distance of
km s-1). These cases are
described individually in more detail in Appendix A.
In six of these instances, the target object is not a superthin, i.e.,
a/b<10. The four exceptions to this are FGC 1845 (a/b=13.3),
UGC 11243 (a/b=11.2), FGC 2264 (a/b=14.3), and ESO 467-063
(a/b=12.4). Although the thinness of the disks of these objects in
the presence of a neighbor within a projected distance of
![]() Mpc is surprising, we do find that 3 of the 4
objects show signs of optical peculiarities, most likely due to the
perturbation of the companion. ESO 467-063 was noted by
Karachentsev et al. (1993) to have "curved ends'', and on the
DSS, both FGC 2264 and UGC 11243 can also be seen to exhibit
curvature. Only FGC 1845 seems to show no obvious optical peculiarities
on the DSS or in optical CCD images obtained by Matthews et al. (unpublished).
Overall we find the results of our survey to be consistent with the
notion that highly flattened pure disk galaxies tend to be relatively
isolated objects, and that the presence of a close neighbor tends to
thicken their disks and/or alter their optical morphologies.
Mpc is surprising, we do find that 3 of the 4
objects show signs of optical peculiarities, most likely due to the
perturbation of the companion. ESO 467-063 was noted by
Karachentsev et al. (1993) to have "curved ends'', and on the
DSS, both FGC 2264 and UGC 11243 can also be seen to exhibit
curvature. Only FGC 1845 seems to show no obvious optical peculiarities
on the DSS or in optical CCD images obtained by Matthews et al. (unpublished).
Overall we find the results of our survey to be consistent with the
notion that highly flattened pure disk galaxies tend to be relatively
isolated objects, and that the presence of a close neighbor tends to
thicken their disks and/or alter their optical morphologies.
Copyright The European Southern Observatory (ESO)