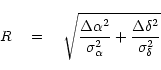
Similar to the procedure outlined in Paper I, we used the likelihood ratio
as described by De Ruiter et al. (1977) to quantify the correctness of
a particular identification.
![]() and
and
![]() are
measured offsets in RA and Dec between the optical and radio
positions,
are
measured offsets in RA and Dec between the optical and radio
positions,
![]() and
and
![]() are the sums of the
squared 1
are the sums of the
squared 1![]() errors in the optical and radio positions. Note that
in most cases the radio accuracy is much higher than in the optical
(cf. Col. 4 in Table 1), so
errors in the optical and radio positions. Note that
in most cases the radio accuracy is much higher than in the optical
(cf. Col. 4 in Table 1), so
![]() and
and
![]() are dominated by the optical error in these
cases. We estimate our optical accuracy to be 0.5
are dominated by the optical error in these
cases. We estimate our optical accuracy to be 0.5
![]() as in all
cases we were able to identify HST guide stars within the field of
view. An R-value less than three indicates a chance less than 1%
to miss a true identification (assuming that the possible counterpart
is the object closest to the radio position). The probability that a
true optical counterpart has an R-value larger than some R0 is
given by
as in all
cases we were able to identify HST guide stars within the field of
view. An R-value less than three indicates a chance less than 1%
to miss a true identification (assuming that the possible counterpart
is the object closest to the radio position). The probability that a
true optical counterpart has an R-value larger than some R0 is
given by
![]() .
Most of our identifications
have R-values smaller than 2, and can be assumed correct. Besides,
some of the higher R-values, for instance in the case of 1601-222
or 1648+015, do not necessarily indicate a misidentification. Their
high R-value may be due to overestimates of the accuracy, which will
artificially inflate the R-value. The identification results are
listed in Table 2, and finding charts for the sources are
presented in Fig. 4. The center of the cross indicates the radio
position, and the angular size of the cross hairs is fixed at
20
.
Most of our identifications
have R-values smaller than 2, and can be assumed correct. Besides,
some of the higher R-values, for instance in the case of 1601-222
or 1648+015, do not necessarily indicate a misidentification. Their
high R-value may be due to overestimates of the accuracy, which will
artificially inflate the R-value. The identification results are
listed in Table 2, and finding charts for the sources are
presented in Fig. 4. The center of the cross indicates the radio
position, and the angular size of the cross hairs is fixed at
20
![]() ,
independent of the plate scale of any particular
observation.
,
independent of the plate scale of any particular
observation.
| Optical position (2000.0) | ||||||||||
| Name | h | m | s |
|
R-value | ID | maga | |||
| 0437-454 | 04 | 39 | 00.84 | -45 | 22 | 22.3 | 0.3 | G | 19.0 I | |
| 0742+103 | 07 | 45 | 33.17 | 10 | 11 | 15.3 | 4.4 | G | ||
| 0802+212 | 08 | 05 | 38.61 | 21 | 06 | 51.6 | 0.9 | G | 22.5 R | |
| 0904+039 | 09 | 06 | 40.98 | 03 | 42 | 42.3 | 0.8 | G | 22.1 I | |
| 1433-040 | 14 | 35 | 40.08 | -04 | 14 | 54.5 | 1.3 | G | 18.3 R | |
| 1540-077b | 15 | 43 | 01.64 | -07 | 57 | 06.8 | 0.4 | G | 17.8 R | |
| 1601-222 | 16 | 04 | 01.41 | -22 | 23 | 42.6 | 2.9 | G | 19.3 R | |
| 1648+015 | 16 | 51 | 03.72 | 01 | 29 | 21.4 | 3.9 | G | 21.4 R | |
| 1732+094 | 17 | 34 | 58.42 | 09 | 26 | 59.5 | 1.1 | G | 21.3 R | |
| 1815-553 | 18 | 19 | 45.40 | -55 | 21 | 20.4 | 0.6 | G | 22.0 V | |
| 1942+722 | 19 | 41 | 27.29 | 72 | 21 | 43.7 | 3.6 | G | 17.64 |
|
| 2121-014 | 21 | 23 | 39.26 | -01 | 12 | 34.2 | 0.9 | G | 18.18 |
|
| 2128+048 | 21 | 30 | 32.94 | 05 | 02 | 17.3 | 1.8 | G | 17.47 |
|
| 2322-040 | 23 | 25 | 10.25 | -03 | 44 | 47.3 | 0.6 | G | 17.46 |
|
a Indicated filters are: Johnson V, I, R, and the near-IR K-band.
b Some confusion reigned about the exact radio position of this source. The optical position listed here is the correct identification (cf. notes on this object).
We estimate the photometric accuracy for the optical bands to be on
the order of 0.1 magnitude for the brighter sources (m
![]() 21),
increasing to
21),
increasing to ![]() 0.4 mag for the faint end of the sample (m
0.4 mag for the faint end of the sample (m![]() 22.5). None of the nights were photometric, and most of the
sources are not properly exposed for accurate photometry. In case of
an empty field (e.g. 1045+019), the optical counterpart must be
fainter than the limiting magnitude of the CCD frames. A conservative
estimate of this limit is
22.5). None of the nights were photometric, and most of the
sources are not properly exposed for accurate photometry. In case of
an empty field (e.g. 1045+019), the optical counterpart must be
fainter than the limiting magnitude of the CCD frames. A conservative
estimate of this limit is ![]() 23 (in any of the bands). The
photometry results can be found in the last column of
Table 2.
23 (in any of the bands). The
photometry results can be found in the last column of
Table 2.
For 22 of the 29 sources, low dispersion spectra were taken with the
sole objective of assessing redshifts. The typical ![]() 30 Å resolution is sufficient to resolve the [O III] 4959/5007 Å doublet, one of the most prominent emission features in optical
spectra of radio galaxies. Furthermore, this resolution is a
reasonable trade-off between signal-per-pixel and spectral resolution.
The results are listed in Table 3. The spectra with
positive line identifications are displayed in Figs. 1
and 2.
30 Å resolution is sufficient to resolve the [O III] 4959/5007 Å doublet, one of the most prominent emission features in optical
spectra of radio galaxies. Furthermore, this resolution is a
reasonable trade-off between signal-per-pixel and spectral resolution.
The results are listed in Table 3. The spectra with
positive line identifications are displayed in Figs. 1
and 2.
The following sources remain without proper redshift determination:
|
0018+729, 0159+839, 0316+161, 0437-454, 0602+780, 0703+468, 0742+103,
0802+212, 0904+039, 0914+114, 1045+019, 1433-040, 1601-222, 1648+015,
1732+094, 1815-553, 1942+772, 2322-040 |
Copyright The European Southern Observatory (ESO)