As shown in Fig. 1, the typical noise spectrum expected for
the PLANCK High Frequency Instrument (HFI) features a drastic increase of noise
power at low frequencies
![]() .
We model this noise spectrum
as:
.
We model this noise spectrum
as:
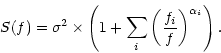 |
(1) |
The Fourier spectrum of the noise on the circle obtained by combining
N consecutive scans depends on the exact method used. The simplest method, setting the circle
equal to the average of all its scans, efficiently filters out all
frequencies save the harmonics of the spinning frequency [Delabrouille et al.1998b]. Since the
noise power mainly resides at low frequencies (see Fig.
1), the averaging transforms - to first order - low
frequency drifts into constant offsets different for each circle and
for each polarimeter. This is illustrated in the comparison between
Figs. 4 and 5. More sophisticated methods for recombining the data
streams into circles can be used, as ![]() minimization, Wiener filtering, or any map-making
method projecting about
minimization, Wiener filtering, or any map-making
method projecting about ![]() samples onto a circle of about
samples onto a circle of about ![]() points.
For simplicity, we will work in the following with the circles obtained by simple averaging of all its
consecutive scans.
points.
For simplicity, we will work in the following with the circles obtained by simple averaging of all its
consecutive scans.
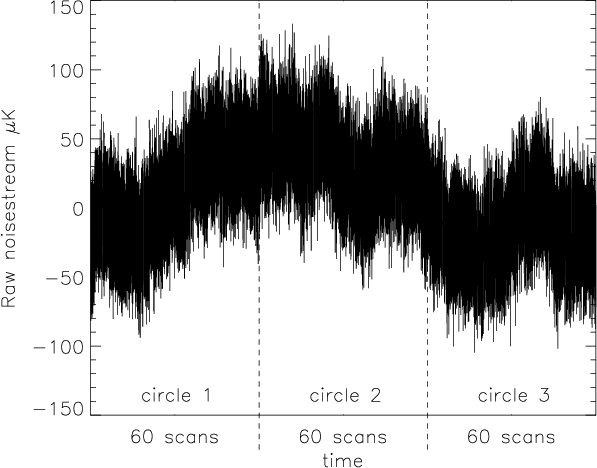 |
Figure 4:
Typical 1/f2 low frequency noise stream.
Here,
|
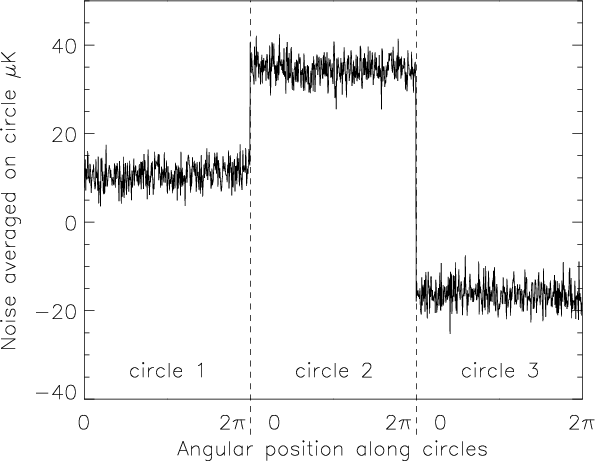 |
Figure 5: The residual noise on the 3 circles after averaging. To first approximation, low frequency drifts are transformed into offsets, different for each circle and each polarimeter. Note the expanded scale on the y-axis as compared to that of Fig. 4 |
We thus model the effect of low frequency drifts as a constant offset
for each polarimeter and each circle. This approximation is excellent
for
![]() .
The remaining white noise of the h polarimeters is
described by one constant
.
The remaining white noise of the h polarimeters is
described by one constant
![]() matrix.
matrix.
Copyright The European Southern Observatory (ESO)