Theoretical studies of the CMB have shown that the accurate
measurement of the CMB anisotropy spectrum ![]() with future
space missions such as PLANCK will allow for tests of cosmological
scenarios and the determination of cosmological parameters with
unprecedented accuracy. Nevertheless, some near degeneracies between
sets of cosmological parameters yield very similar CMB temperature
anisotropy spectra. The measurement of the CMB polarization and the computation of
its power spectrum [Seljak1996,Zaldarriaga1998] may lift to some extent some of these degeneracies.
It will also provide additional information on the reionization epoch and
on the presence of tensor perturbations, and may also help in the
identification and removal of polarized astrophysical foregrounds
[Kinney1998,Kamionkowski1998,Prunet & Lazarian1999].
with future
space missions such as PLANCK will allow for tests of cosmological
scenarios and the determination of cosmological parameters with
unprecedented accuracy. Nevertheless, some near degeneracies between
sets of cosmological parameters yield very similar CMB temperature
anisotropy spectra. The measurement of the CMB polarization and the computation of
its power spectrum [Seljak1996,Zaldarriaga1998] may lift to some extent some of these degeneracies.
It will also provide additional information on the reionization epoch and
on the presence of tensor perturbations, and may also help in the
identification and removal of polarized astrophysical foregrounds
[Kinney1998,Kamionkowski1998,Prunet & Lazarian1999].
A successful measurement of the CMB polarization stands as an
observational challenge; the expected polarization level is of the order of
![]() of the level of temperature fluctuations (
of the level of temperature fluctuations (
![]() ). Efforts have thus gone into developing techniques to
reduce or eliminate spurious non-astronomical signals and instrumental
noise which could otherwise easily wipe out real polarization signals.
In a previous paper [Couchot et al.1999], we have shown how to configure
the polarimeters in the focal plane in order to minimize the errors on
the measurement of the Stokes parameters. In this paper, we address the problem of
low frequency noise.
). Efforts have thus gone into developing techniques to
reduce or eliminate spurious non-astronomical signals and instrumental
noise which could otherwise easily wipe out real polarization signals.
In a previous paper [Couchot et al.1999], we have shown how to configure
the polarimeters in the focal plane in order to minimize the errors on
the measurement of the Stokes parameters. In this paper, we address the problem of
low frequency noise.
Low frequency noise in the data streams can arise due to a wide range
of physical processes connected to the detection of radiation. 1/fnoise in the electronics, gain instabilities, and temperature
fluctuations of instrument parts radiatively coupled to the detectors,
all produce low frequency drifts of the detector outputs.
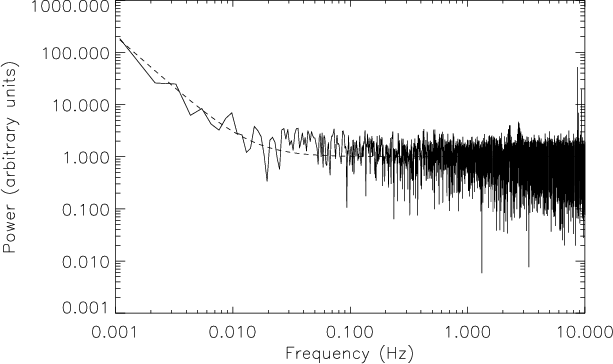
The spectrum of the total noise can be modeled as
a superposition of white noise and components behaving like
![]() where
where
![]() ,
as shown in Fig.
1.
,
as shown in Fig.
1.
This noise generates stripes after reprojection on maps, whose exact form depends on the scanning strategy. If not properly subtracted, the effect of such stripes is to degrade considerably the sensitivity of an experiment. The elimination of this "striping'' may be achieved using redundancies in the measurement, which are essentially of two types for the case of PLANCK:
| |
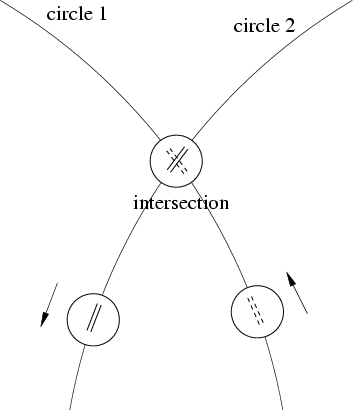
Figure 2:
The Mollweide projection of 3 intersecting circles. For clarity, the scan angle
between the spin axis and the main beam axis is set to |
The rest of the paper is organized as follows: in Sect. 2, we explain how we model the noise and how low frequency drifts transform into offsets when considering the circles instead of individual scans. In Sect. 3, we explain how polarization is measured. The details of the algorithm for removing low-frequency drifts are given in Sect. 4. We present the results of our simulations in Sect. 5 and give our conclusions in Sect. 6.
Copyright The European Southern Observatory (ESO)