next previous
Up: HI observations of nearby


1 Introduction

The only way to study the smallest galaxies is to search for them in our cosmic neighborhood. The first systematic catalog of nearby galaxies was prepared by Kraan-Korteweg & Tammann (1979) who collected all known galaxies with corrected radial velocities v0 $\le$ 500 kms-1, a total of 179 objects (hereafter called the KKT sample). Since that time the number of known galaxies within the Local Volume (i.e. within a distance of 10 Mpc) increased to 303 objects (Karachentsev et al. 1999). For the past decade the initial KKT sample has been increased almost two times in number due to the mass redshift surveys of galaxies from the known catalogues, revealing new nearby galaxies in the Milky Way "Zone of Avoidance", as well as special searches for dwarf galaxies in nearby groups. The increasing numbers of galaxies in the Local Volume is mainly due to many new dwarf galaxies. This fact demonstrates how incomplete our knowledge about the galaxy population of even the Local Volume is.

A couple of years ago Karachentseva & Karachentsev (1998; hereafter KK98) initiated an all-sky search for candidates for new nearby dwarf galaxies using the second Palomar Sky Survey and the ESO/SERC plates of the southern sky. The results of the first two segments of the survey have been published, they cover large areas around the known galaxy groups in the Local Volume (KK98) and the area of the Local Void (Karachentseva et al. 1999). In a next step to derive distances we will measure radial velocities. Later on we will aim for more exact photometric distances. In this paper we present the first follow-up observations, the HI search for the galaxies in KK98. The HI search for dwarf irregular galaxies seems quite efficient as these galaxies are HI rich in general and with adequate velocity resolution, say 5 kms-1, all the HI of a given galaxy will be within a few velocity channels. The characteristic signature of a dwarf galaxy profile, a nearly gaussian structure, is different from radio interference and easily will lead to a good signal-to-noise ratio.


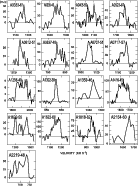
  \begin{figure}\psfig{figure=hkkmf1a.ps,width=15cm}\addtocounter{figure}{-1}
\end{figure} Figure 1: HI profiles observed with the 100-m radio telescope at Effelsberg which has a HPBW of 9 $.\mkern -4mu^\prime $3 at a wavelength of 21 cm. Observations were obtained in the total power mode [ON - OFF] which yields a residual of the Local HI emission around 0 km s-1. The profiles are arranged in ascending R.A. starting at the bottom left corner


 \begin{figure}\psfig{figure=hkkmf1b.ps,width=15cm}
\addtocounter{figure}{-1}
\end{figure} Figure 1: continued


 \begin{figure}\psfig{figure=hkkmf1c.ps,width=15cm}
\end{figure} Figure 1: continued


  \begin{figure}\psfig{figure=hkkmf2.ps,width=12cm}\end{figure} Figure 2: HI profiles observed with the Nançay radio telescope (HPBW of $3\hbox {$.\mkern -4mu^\prime $ }6 \times 22\hbox {$^\prime $ }$ for the declination range in question)


  \begin{figure}\psfig{figure=hkkmf3.ps,width=12cm}\end{figure} Figure 3: HI profiles observed with the Australia Telescope Compact Array. The synthesized antenna beam is of the order of 1 $\hbox {$^\prime $ }$


next previous
Up: HI observations of nearby

Copyright The European Southern Observatory (ESO)