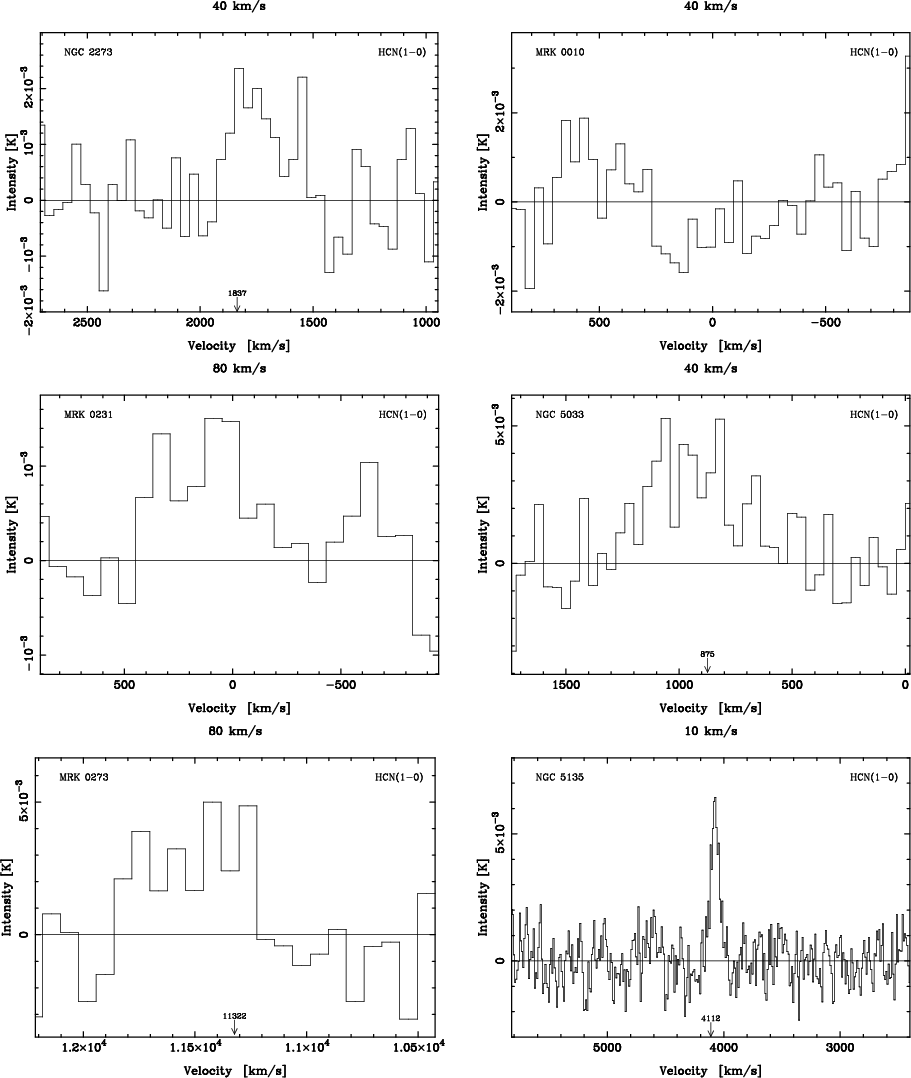
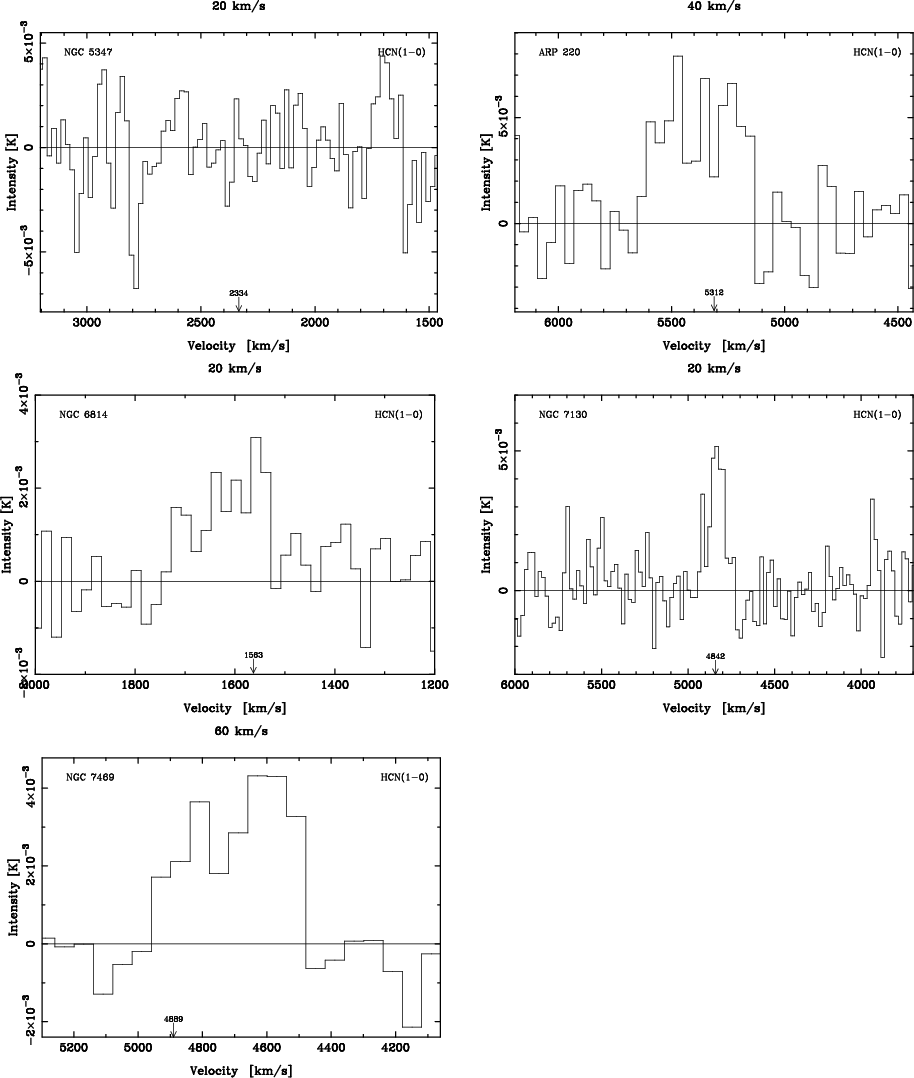
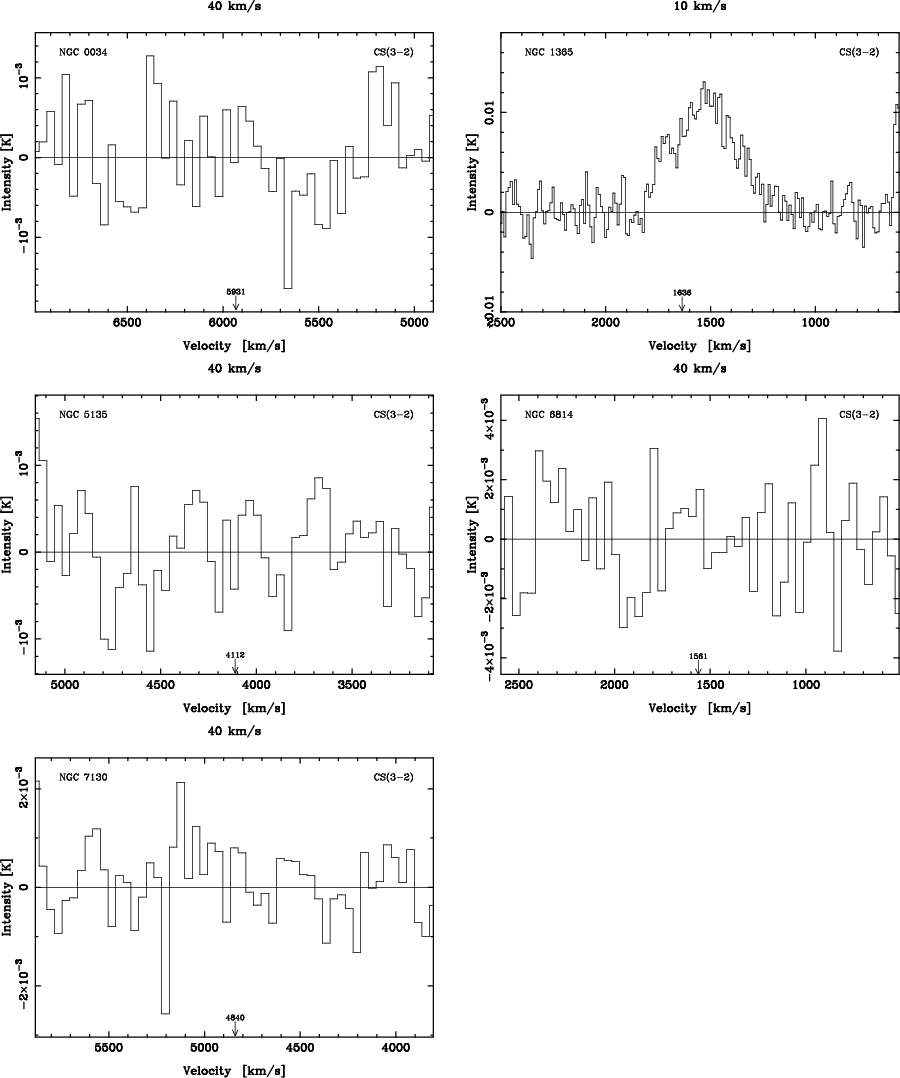
 |
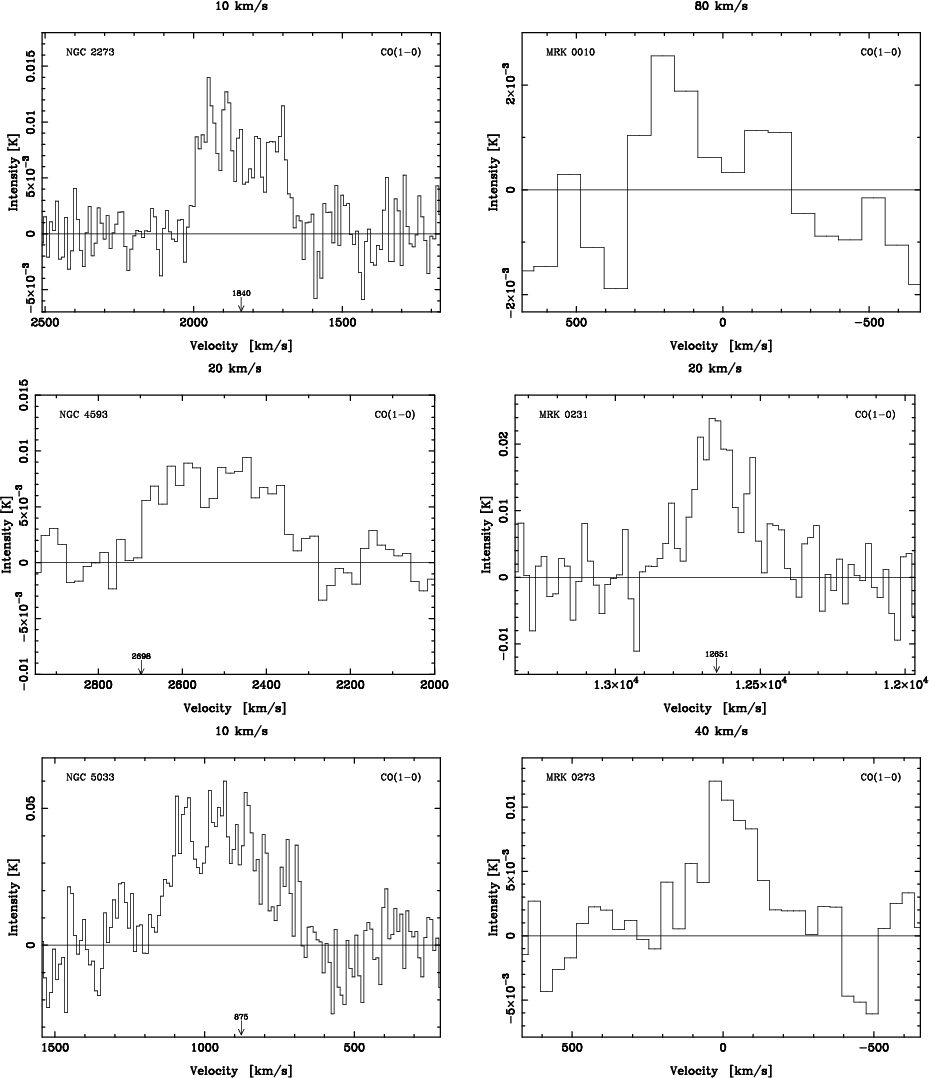
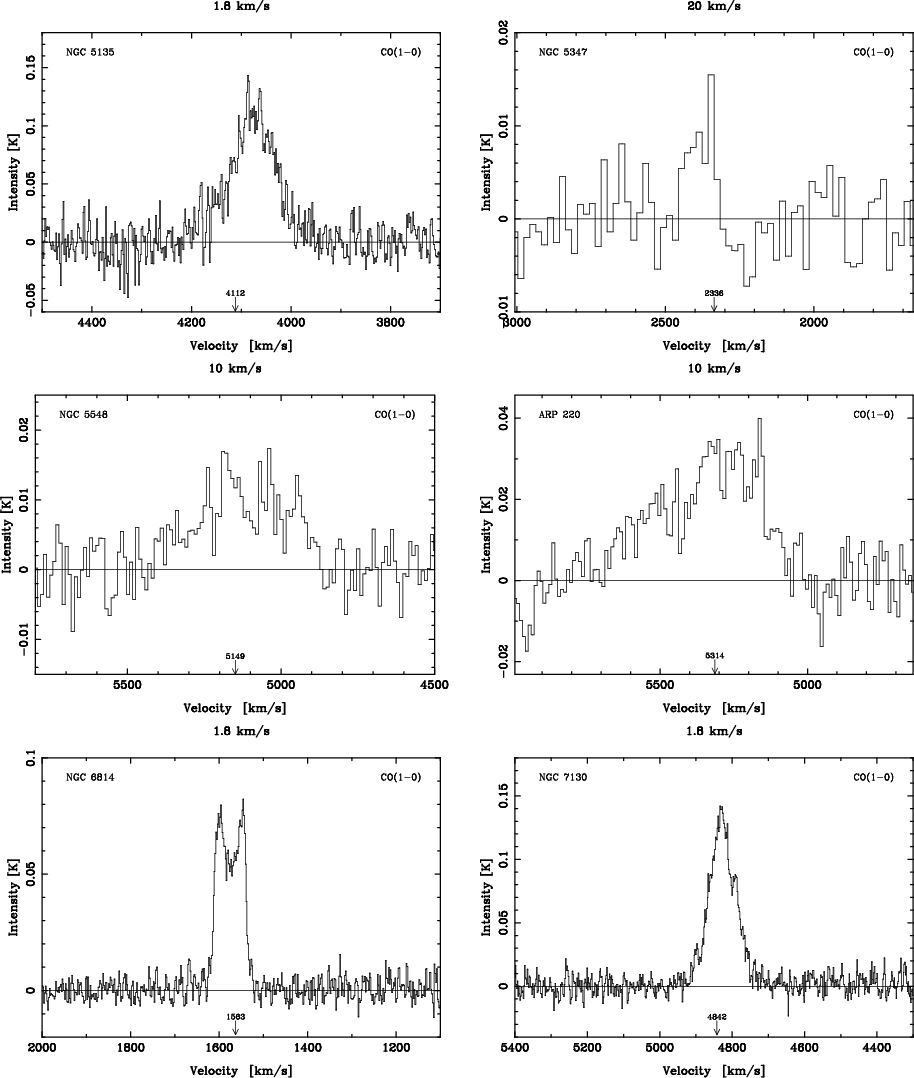
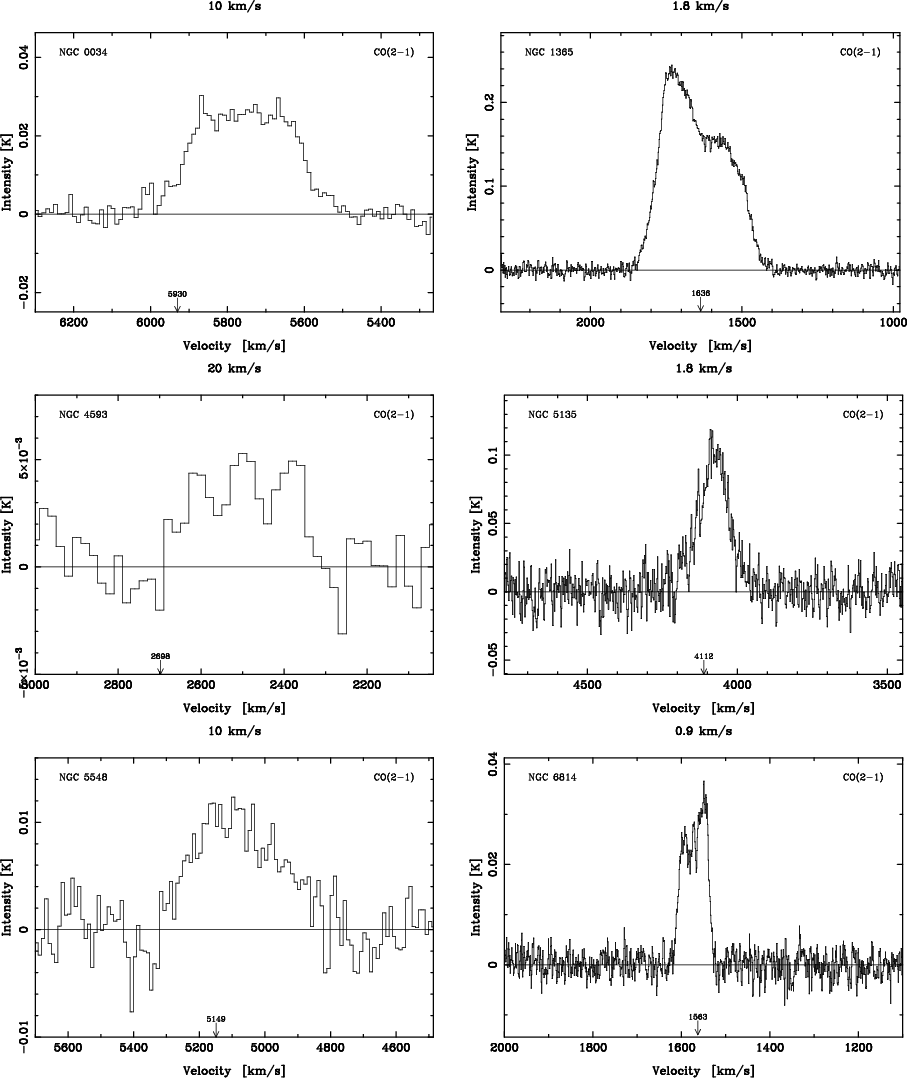
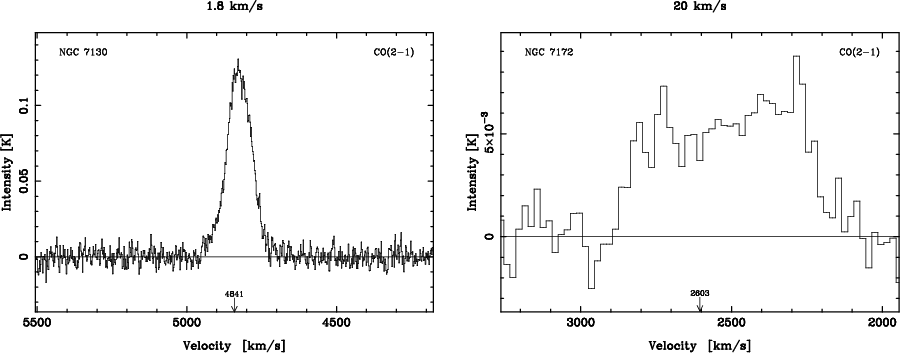
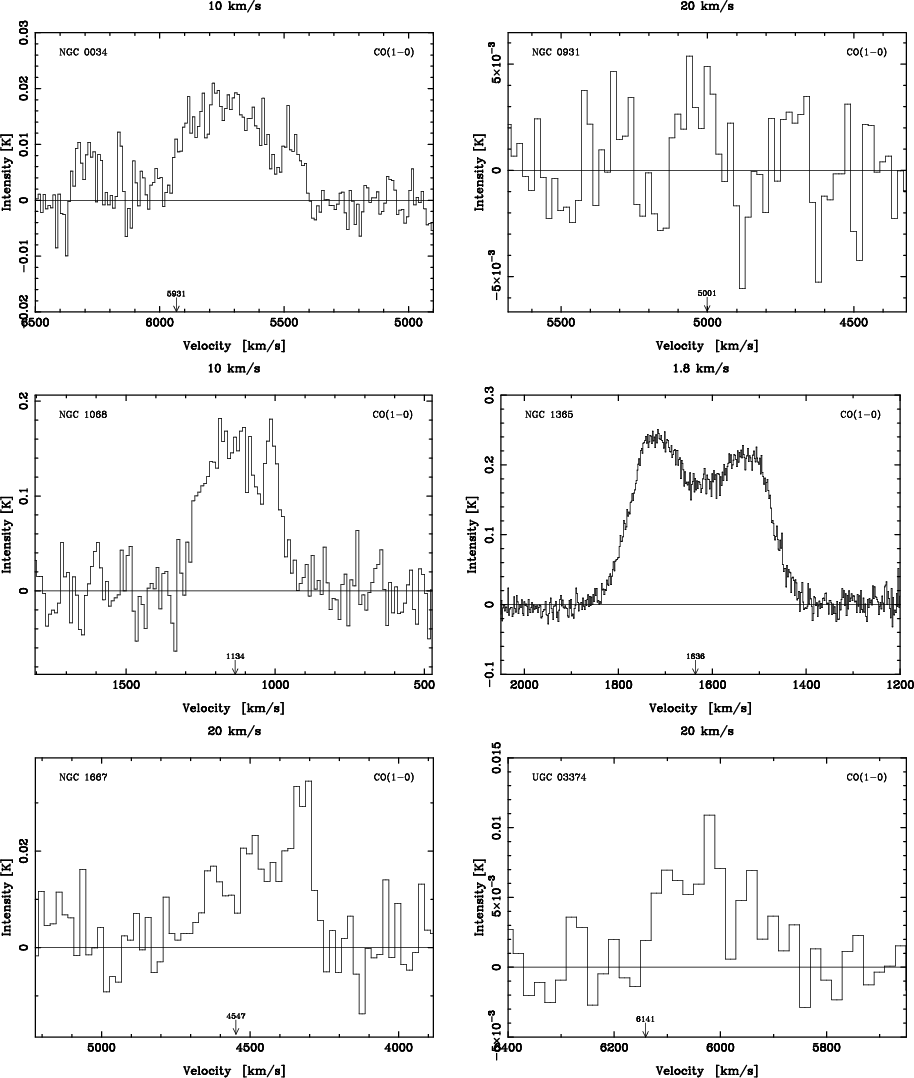
Figure 1:
The CO
|
Upon comparison of the CO detections (Figs. 1 and 2)
with those from previous surveys (Heckman et al. 1989;
Maiolino et al. 1997; Papadopoulos & Seaquist 1998),
we find that, for the most part, we have similar results with the following
exceptions: CO
![]() in NGC 1365 is similar to that of
Maiolino et al. (1997); Papadopoulos & Seaquist (1998),
although more symmetric than the detection of
Heckman et al. (1989). Our
in NGC 1365 is similar to that of
Maiolino et al. (1997); Papadopoulos & Seaquist (1998),
although more symmetric than the detection of
Heckman et al. (1989). Our
![]() detection is not as symmetric as
that of Papadopoulos & Seaquist (1998) and since the profile of
Sandqvist et al. (1995) is also
quite symmetrical we attribute our asymmetry to a pointing error. In NGC 1667
the profile is identical in shape to that of Heckman et al. (1989)
but reflected with the peak occurring at the minimum, as opposed maximum
velocity. In the case of Maiolino et al. (1997); Papadopoulos & Seaquist
(1998), the peak also occurs at
the maximum although these are somewhat more symmetric, indicating
that we have a pointing error. NGC 5033; our detection appears to be
somewhat skewed compared with those of Heckman et al. (1989);
Maiolino et al. (1997); Papadopoulos & Seaquist (1998),
although of a similar integrated intensity. NGC 5548; undetected by
Heckman et al. (1989) and not observed by Papadopoulos & Seaquist (1998), our detection has a
somewhat wider profile than that of Maiolino et al. (1997). The
results of the observations are summarised in Table
2
detection is not as symmetric as
that of Papadopoulos & Seaquist (1998) and since the profile of
Sandqvist et al. (1995) is also
quite symmetrical we attribute our asymmetry to a pointing error. In NGC 1667
the profile is identical in shape to that of Heckman et al. (1989)
but reflected with the peak occurring at the minimum, as opposed maximum
velocity. In the case of Maiolino et al. (1997); Papadopoulos & Seaquist
(1998), the peak also occurs at
the maximum although these are somewhat more symmetric, indicating
that we have a pointing error. NGC 5033; our detection appears to be
somewhat skewed compared with those of Heckman et al. (1989);
Maiolino et al. (1997); Papadopoulos & Seaquist (1998),
although of a similar integrated intensity. NGC 5548; undetected by
Heckman et al. (1989) and not observed by Papadopoulos & Seaquist (1998), our detection has a
somewhat wider profile than that of Maiolino et al. (1997). The
results of the observations are summarised in Table
2![]() , where the upper limits for
HCN
, where the upper limits for
HCN
![]() and
and
![]() are over the velocity range of the CO
are over the velocity range of the CO
![]() detections.
detections.
| Galaxy | Sy | v [km s-1] | Teles. | CO
|
CO
|
HCN
|
New | CS
|
| NGC 0034 | 2 | 5931 | SEST | 10(1) | 18(1) | 1.6(0.2) | <1 | |
| NGC 0931 | 1.5 | 5001 | OSO | 0.5(0.4) | - | <0.8 | - | |
| NGC 1068 | 2 | 1134 | OSO | 86(3) | - | 11(1) | - | |
| NGC 1365 | 1.8 | 1636 | SEST | 97(1) | 110(1) | 6.0(0.1) | 6.3(0.3) | |
| NGC 1667 | 2 | 4547 | OSO | 15(1) | - | 3.5(0.5) | - | |
| UGC 03374/MCG 08-11-011 | 1.5 | 6141 | OSO | 2.8(0.3) | - | <0.2 | - | |
| NGC 2273 | 2 | 1840 | OSO | 3.2(0.3) | - | 0.5(0.3) | - | |
| Mrk 10/UGC 04013 | 1 | 8770 | OSO | 1.0(0.3) | - | <0.3 | - | |
| NGC 4593 |
1 | 2698 | SEST | 1.7(0.4) | 2.2(0.3) | - | - | |
| Mrk 231/UGC 08058 | 1 | 12651 | OSO | 10(1) | - | 1.0(0.2) | - | |
| NGC 5033 | 1.9 | 875 | OSO | 32(2) | - | 1.7(0.3) | - | |
| Mrk 273/UGC 08696 | 2 | 11318 | OSO | 5(1) | - | 3(1) | - | |
| NGC 5135 | 2 | 4112 | SEST | 18(1) | 25.8(0.6) | 0.65(0.07) | <1 | |
| NGC 5347 | 2 | 2336 | OSO | 1.3(0.5) | - | <0.3 | - | |
| NGC 5548 |
1.5 | 5149 | SEST | 2.4(1.2) | 7.0(0.4) | - | - | |
| Arp 220 | 2 | 5314 | OSO | 12(1) | - | 2.4(1.0) | - | |
| NGC 6814 | 1.5 | 1563 | SEST | 7.2(0.1) | 3.9(0.1) | 0.45(0.08) | <1 | |
| NGC 7130/IC 5135 | 2 | 4842 | SEST | 17(1) | 26(1) | 0.7(0.1) | <1 | |
| NGC 7172 | 2 | 2603 | SEST | 5.1(0.9) | 7.3(0.3) | - | - | |
| NGC 7469 | 1.2 | 4889 | OSO | 22(1) | - | 1.7(0.4) | - | |
The luminosities according to the integrated intensity over the
projected beam area are shown in Table 3![]() .
.
| Galaxy | Sy |
|
|
|
|
|
|
| NGC 0034 | 2 | - |
|
|
<0.1 | 14.3 | |
| NGC 0931 | 1 |
|
- | - | <0.1 | - | 2.1 |
| NGC 1068 | 2 |
|
|
- |
|
- | 7.4 |
| NGC 1365 | 2 | 5.3c | 0.48 |
|
|
6.8 | |
| NGC 1667 | 2 |
|
- | - |
|
- | 4.2 |
| UGC 03374 | 1 |
|
- | - | <0.05 | - | 2.9 |
| NGC 2273 | 2 |
|
|
- |
|
- | 0.66 |
| Mrk 10 | 1 | - | - | <0.1 | - | 2.7 | |
| NGC 4593 | 1 |
|
- |
|
- | - | 0.79 |
| Mrk 231 | 1 | 5d | - | - | 128 | ||
| NGC 5033 | 2 |
|
- |
|
- | 0.53 | |
| Mrk 273 | 2 | - | - | - | 73 | ||
| NGC 5135 | 2 | - |
|
|
<0.06 | 9.0 | |
| NGC 5347 | 2 |
|
- | - | <0.01 | - | 0.28 |
| NGC 5548 | 1 | - |
|
- | - | 0.86 | |
| Arp 220 | 2 | - | - | - | 84 | ||
| NGC 6814 | 1 |
|
|
0.015 |
|
<0.01 | 0.66 |
| NGC 7130 | 2 | - | 0.96 |
|
<0.03 | 11.9 | |
| NGC 7172 | 2 |
|
- |
|
- | - | 1.2 |
| NGC 7469 | 1 |
|
|
- |
|
- | 18.2 |
| Galaxy | Sy |
|
Published intensity ratios |
| NGC 0034 | 2 | 4 | - |
| NGC 0931 | 1 |
|
- |
| NGC 1068 | 2 | 5 | 9 (Helfer & Blitz 1993) |
| NGC 1365 | 2 | 9 | - |
| NGC 1667 | 2 | 3 | - |
| UGC 03374 | 1 |
|
- |
| NGC 2273 | 2 | 5 | - |
| Mrk 10 | 1 |
|
- |
| Mrk 231 | 1 | 6 | 4.2 (SDR92) |
| NGC 5033 | 2 | 7 | - |
| Mrk 273 | 2 | 1 | - |
| NGC 5135 | 2 | 18 | - |
| NGC 5347 | 2 |
|
- |
| Arp 220 | 2 | 7 | 8 (SDR92) |
| NGC 6814 | 1 | 11 | - |
| NGC 7130 | 2 | 16 | 13 (Aalto et al. 1995) |
| NGC 7469 | 1 | 4 | 10 (Bryant 1997) |
 |
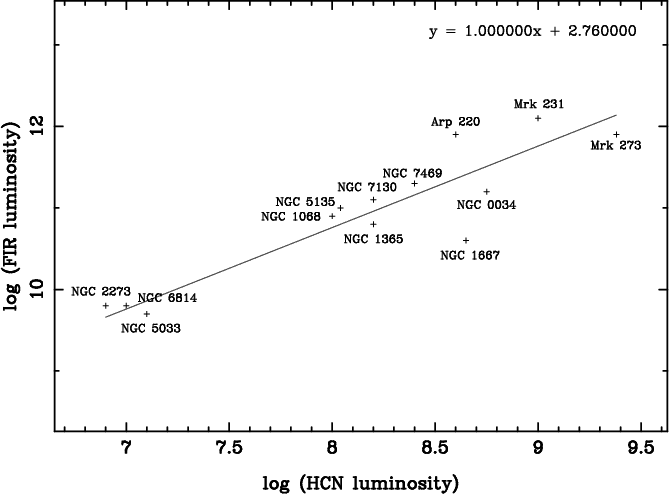
Figure 5:
|
From the intercept of the log plot, we estimate the
![]() to
to
![]() ratio for the sample to be similar to the value
determined for the ULIRGs (SDR92; Bryant 1997). It is interesting
that this relationship holds true for both the distant
(
ratio for the sample to be similar to the value
determined for the ULIRGs (SDR92; Bryant 1997). It is interesting
that this relationship holds true for both the distant
(
![]() km s-1) and near-by (
km s-1) and near-by (
![]() km s-1) sources,
as it implies that the global CO/HCN luminosity ratio for distant
sources
km s-1) sources,
as it implies that the global CO/HCN luminosity ratio for distant
sources ![]() the central ratio for near-by sources
the central ratio for near-by sources ![]() .
If we plot the global CO values from the literature, Table 3,
against the observed HCN luminosities we obtain a ratio of
.
If we plot the global CO values from the literature, Table 3,
against the observed HCN luminosities we obtain a ratio of
![]() .
.
In order to determine the far infrared/HCN luminosity correlation,
i.e. compare our results with those of SDR92, we plotted
![]() against
against
![]() ,
for all
,
for all![]() of the
sources, Fig. 6. Here we see
that we again obtain a fair linear relationship between
the FIR and the HCN luminosities and from this we determine
of the
sources, Fig. 6. Here we see
that we again obtain a fair linear relationship between
the FIR and the HCN luminosities and from this we determine
![]() .
.
Copyright The European Southern Observatory (ESO)