In the case of threshold filtering, described in Sect. 3, the kurtosis criterion is used to find the optimum threshold which must be set to separate the deterministic component from the stochastic one. In a general case, with several components, or with two deterministic components the kurtosis criterion may be difficult to use. In that case components may be separated by performing the principal component analysis of the ampligram matrix. The principal component analysis is a method to resolve a data matrix into a number of orthogonal components. If the data matrix is a sample of a multivariate time series, the principal components, in which the matrix is resolved, reflect the independent, orthogonal constituents of the process described by the multivariate time series.
Since the ampligram may be considered as a multivariate time series (L=20, N=1024 for the above low-20 ampligram) the principal component analysis may be used to identify the number of independent modes in the data. A multivariate time series consisting of L variables measured at N equally separated instants forms a matrix Y. The next step of the analysis is to perform the principal component analysis (PCA) of the matrix Y. The results of PCA are:
The matrix S of component scores is thus the new multivariate time series
in the principal component space. It has been found by the present author
that, in all cases when filtering was performed in the principal component
space, a considerable improvement of signal-to-noise ratio has been obtained
without distorting the signal.
Each column of S is low-pass filtered using a simple filter. The result
of filtering is matrix ![]() .
After filtering an inverse transform:
.
After filtering an inverse transform:
The operation may be repeated for each interesting component l.
As the principal component transformation preserves the variance, the sum of
all latent roots, ![]() ,
is equal to the total variance. If
the data is standardized, i.e. normalized to standard deviation for each
variable, the sum of latent roots is equal to number of variables. The
magnitude of latent roots is usually expressed in percent of the total
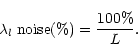
variance. If the data contains only pure noise, all variables will be
uncorrelated, and the total variance will be evenly distributed between
all latent roots:
,
is equal to the total variance. If
the data is standardized, i.e. normalized to standard deviation for each
variable, the sum of latent roots is equal to number of variables. The
magnitude of latent roots is usually expressed in percent of the total
variance. If the data contains only pure noise, all variables will be
uncorrelated, and the total variance will be evenly distributed between
all latent roots:
Copyright The European Southern Observatory (ESO)