
Up: Extraction of a deterministic
10 Analysis of simulated photon flux
In the case of X-rays from AGN there might be a physical source of
deterministic variations of the photon flux.
Pacholczyk & Stoeger Pacholczyk94 propose "building blocks'' in
the X-ray photon flux from active galactic nuclei.
In the present study each building block is assumed to be formed by a Poisson
process. A Poisson process may be simulated [Råde & Westergren1995] using a
series of random numbers according to the formula
 |
(12) |
where ti is time of event i, Xni is a
random number between 0 and 1 and C is
the Poisson parameter, called also the process intensity. The event series is
then converted into an event rate plot by counting events in consecutive time
bins.
In the present case it is assumed that each block is a fragment of a Poisson
process with the process intensity within each block, C decreasing with time
according to:
where
 is the starting process intensity, tj
is the time of the j-th photon
measured from the beginning of the building block and k is the exponent
determining the rate of decay of the block.
The simulations were performed assuming random values for the number of
photons in each block, NP, the number of building blocks during the simulation
period, NB, and a pair of values for
 and k.
The results of simulations have shown that there will be a significant
difference in the character of time scale spectrum depending on if building
blocks are superimposed in a semi-regular manner or randomly.
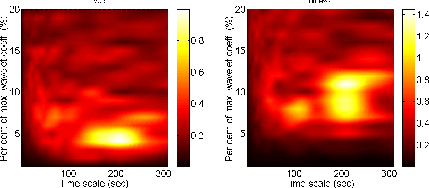
Figure 18 (left diagram) shows the time scale spectrum for randomly
superimposed blocks (NB = 35, NP = 214,
 and k=2.27), while in the
right diagram the building blocks were superimposed in a semi-regular
manner (NB = 8, NP = 238,
 ,
k=0.615 and the average period between
blocks is 200
  40 s). Note the linear scale of x-axis on both
diagrams.
 |
Figure 18:
Time scale spectrum of simulated superposition of building blocks:
random (left) and semi-regular (average period 200  40 s)
(right diagram). Linear scale of x-axis
 |
It may be seen that the character of superposition of Poisson-like building
blocks may be studied using the present method. Also number of building blocks
per time unit may be determined.


Up: Extraction of a deterministic
Copyright The European Southern Observatory (ESO)

