

The Catalogue is presented in three tables.
Table 1 gives the list of UV Cet-type stars in the solar vicinity with their coordinates, proper motions, names and catalogued designations, the last ones are taken mainly from SIMBAD.
Coordinates for 1950.0 were adopted from Gliese (1969), Gliese & Jahreiss (1979, 1991), Kholopov (1985, 1987), Samus (1990), Kholopov et al. (1985, 1987, 1989), Kazarovets & Samus (1990) or from one of the first publications on stellar activity.
Coordinates for 2000.0 were taken from two sources.
Data for more than half stars considered were prepared by Dr. N.N. Samus
and E.N. Pastukhova as a part of their work to form a modern
astrometric basis for the General Catalogue of Variable Stars.
They used the HIPPARCOS catalog (ESA 1997), the PPM catalog
(Roeser & Bastian 1991, 1993);
the Space Telescope Guide Star catalog (Lasker et al.
1990); the US Naval Observatory A1.0 catalog (Monet 1996);
accurate coordinates from publications and original measurements
from Digitized Sky Survey images with GSC stars as reference.
Most flare stars have large proper motions. In many cases,
such proper motions are not well known. Moreover, in
several cases, the epochs of published positions are approximate
to a couple of years. For this reason we present coordinates
at 2000.0 to
 in right ascension and to 1
 in
declination. In the cases of known proper motions, the coordinates
were reduced to equinox and epoch 2000.0; such coordinates
are accompanied by the values of the annual proper motions in right
ascension and in declination. If proper motions are not available,
the coordinates are accompanied, whenever possible, with their epoch
values (the equinox being still 2000.0).
Data for rest stars labelled by asterisks were determined by Hawley et
al. (1996) from the Space Telescope Digitized Sky Survey. Proper motions
for these stars are from Gliese & Jahreiss (1991). For about dozen
systems the astrometric data for A and B (or C) components are accessible
only from independent sources; their disagreements show the realistic
accuracy of the distance and proper motion determinations.
in
declination. In the cases of known proper motions, the coordinates
were reduced to equinox and epoch 2000.0; such coordinates
are accompanied by the values of the annual proper motions in right
ascension and in declination. If proper motions are not available,
the coordinates are accompanied, whenever possible, with their epoch
values (the equinox being still 2000.0).
Data for rest stars labelled by asterisks were determined by Hawley et
al. (1996) from the Space Telescope Digitized Sky Survey. Proper motions
for these stars are from Gliese & Jahreiss (1991). For about dozen
systems the astrometric data for A and B (or C) components are accessible
only from independent sources; their disagreements show the realistic
accuracy of the distance and proper motion determinations.
The identification of stars with ROSAT and EUVE sources is achieved by cross-referencing with the list of ROSAT sources by Shara et al. (1993), the 1st EUVE catalogue by Malina et al. (1994) and the 2nd EUVE catalogue by Bowyer et al. (1996).
We include AM Her with unseen flare components(USCs)
detected only during its powerful optical flare, and  Boo, whose
flare component was detected only during a radio burst.
Boo, whose
flare component was detected only during a radio burst.
According to the current stellar evolution concept, the T Tau-type variables are predecessors of the UV Cet stars, at least, of the more massive of them. The RS CVn variables are the post-main sequence stage of spectroscopic binary systems with components of small and moderate masses. However, in both cases the transitions to and from the UV Cet-type variables are not sharp. Therefore, there is a possible confusion in classification, and some objects regarded as UV Cet stars may belong also to the T Tau or RS CVn variables.
Table 2 contains data from optical and infrared observations. One of the designations reported in Table 1 and indications on a component if a star is a member of a binary system (independently on that such indication exists or is absent in the designation used) are given in Cols. 1 and 2 respectively. Distances (Col. 3) are from trigonometric parallaxes from the HIPPARCOS catalog (ESA 1997) and from Gliese & Jahreiss (1991) or from spectral parallaxes from Hawley et al. (1996) (marked by asterisks) and from several different parallax sources (marked by #). Spectral classes (Col. 4) are from different older sources and, after "/'', from homogeneous classification by Hawley et al. (1996). Equivalent widths of the H-alpha emission line approximated to 0.1 Å for 321 stars from Hawley et al. (1996) and, marked by asterisks, from spectral data of Stauffer & Hartmann (1986) and from photometric measurements by Herbst & Miller (1989) are given in Col. 5. UBV photometric data are listed in Cols. 6-9. Initially, the latter data were adopted from the same sources as the 1950.0 coordinates. Some stars have multicolour photometric data (Cols. 6-15), adopted from Pettersen (1976) or from Doyle & Butler (1990). Then, photometric data were taken from SIMBAD. We follow photometric systems in accordance to Bessel (1990) and Leggett (1992). Photometric observations of close binaries give the total brightnesses of the systems and such data are marked by "J''. Several of them were resolved by HIPPARCOS. Thus, the photometric data in Table 2 are not strictly homogeneous, and should be used as approximate values only.
The IRAS fluxes in Jy = 10
 (Cols. 16-19), are given accordingly to Tsikoudi (1988, 1990),
Mullan et al. (1989) and Mathioudakis & Doyle (1993).
Numbers within [ ] are upper limits given as 3 times of the noise level at the
positions of sources.
(Cols. 16-19), are given accordingly to Tsikoudi (1988, 1990),
Mullan et al. (1989) and Mathioudakis & Doyle (1993).
Numbers within [ ] are upper limits given as 3 times of the noise level at the
positions of sources.
The bolometric luminosities (Col. 20) are from Bookbinder (1985), Tsikoudi (1988), Pallavicini et al. (1990), Doyle & Butler (1990) and Katsova & Tsikoudi (1993). The stellar masses (Col. 21) and stellar radii (Col. 22) in solar units are taken from Rodonò (1986), Doyle & Butler (1990), Panagi & Mathioudakis (1993), Zakhozhaj (1994) and several particular publications. The last column (23) of the Table 2 contains indications of photometrical evidence for stellar spottedness, the existence for such data (from Alekseev & Gershberg 1996) is indicated by "S''.
Table 3 contains non-optical data on the stars in their quiet state.
The EINSTEIN data, presented as the Imaging Proportional
Counter (IPC) fluxes (0.15 - 4 keV) from the Slew Survey where
1 count
 (Col. 24), are taken from
Elvis et al. (1992). The values of the X-ray luminosities
(Col. 25) in erg
(Col. 24), are taken from
Elvis et al. (1992). The values of the X-ray luminosities
(Col. 25) in erg
 are from Bookbinder (1985),
Agrawal et al. (1986), and Katsova & Tsikoudi (1993).
are from Bookbinder (1985),
Agrawal et al. (1986), and Katsova & Tsikoudi (1993).
The EXOSAT data, obtained with the Low Energy (LE) Detector (0.05 - 2 keV)
in erg
(Col. 26), are given according to
Schmitt & Rosso (1988) and Pallavicini et al. (1990).
The ROSAT data are obtained for the All-Sky Survey
from the both Wide-Field Camera (WFC) and the Position-Sensitive
Proportional Counter (PSPC). The WFC used two filters:
S1a (90-185 eV) with the maximum around 124 eV, and S2a
(62-111 eV) with the maximum around 90 eV. The WFC count
rates in counts
 ,
taken from Pound et al. (1993) and Wood et
al. (1994), are presented in Col. 27. For a plasma temperature within the
range of
,
taken from Pound et al. (1993) and Wood et
al. (1994), are presented in Col. 27. For a plasma temperature within the
range of
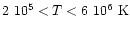 and
for column density
and
for column density
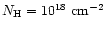 ,
1 count
for S1a filter is
,
1 count
for S1a filter is
 and
1 count
for S2a filter is
and
1 count
for S2a filter is
 .
For
.
For
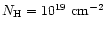 ,
the corresponding fluxes are
,
the corresponding fluxes are
 and
and
 ,
respectively.
In general, in making quantitative use of the WFC data, conversion
from WFC count rates into fluxes must be carried out for any input
spectrum, using the effective area curves reproduced in Fig. 3 of
Pounds et al. (1993). The S1a and/or S2a filter count rates marked
by "F'' were enhanced by flare events. The PSPC data from
the ROSAT all-sky survey in the range
0.1-2.4 keV for apparent X-ray fluxes in
,
respectively.
In general, in making quantitative use of the WFC data, conversion
from WFC count rates into fluxes must be carried out for any input
spectrum, using the effective area curves reproduced in Fig. 3 of
Pounds et al. (1993). The S1a and/or S2a filter count rates marked
by "F'' were enhanced by flare events. The PSPC data from
the ROSAT all-sky survey in the range
0.1-2.4 keV for apparent X-ray fluxes in
 (Col. 28) are
taken from Schmitt et al. (1995) and from Hünsch et al. (1998). The
values of
(Col. 28) are
taken from Schmitt et al. (1995) and from Hünsch et al. (1998). The
values of
 (Col. 29) in erg
are from
Fleming et al. (1993) and Hünsch et al. (1999). The latest X-ray
luminosities are derived by Hünsch et al. (1999) using the stars' distances
as given by HIPPARCOS.
(Col. 29) in erg
are from
Fleming et al. (1993) and Hünsch et al. (1999). The latest X-ray
luminosities are derived by Hünsch et al. (1999) using the stars' distances
as given by HIPPARCOS.
The results of the Extreme-Ultraviolet Explorer (EUVE) mission for
red dwarf stars are from Bowyer et al.
(1996). Count rates of sources
detected during the all-sky survey as well as by deep exposures with
the scanner telescopes for four bands, 100 Å, 200 Å, 400 Å, and
600 Å are listed in Cols. 30 - 33 in counts
.
To convert
count rates into absolute band energy fluxes, it is necessary
to use the absolute effective areas. The wavelength-integrated
effective areas,
 in cm2. Å for four
sky-survey filter bands of EUVE adopted from Table 5 of Bowyer et al.
(1996), are the following: 100 Å - 753; 200 Å - 186;
400 Å - 33; 600 Å - 93. Detections for 11 stars obtained with
the scanner telescope by deep exposures or by long exposures with the
deep-survey instrument are marked by "#''; other values of the
effective-area integrals should be used for them, namely:
100 Å - 1608; 200 Å - 992.
in cm2. Å for four
sky-survey filter bands of EUVE adopted from Table 5 of Bowyer et al.
(1996), are the following: 100 Å - 753; 200 Å - 186;
400 Å - 33; 600 Å - 93. Detections for 11 stars obtained with
the scanner telescope by deep exposures or by long exposures with the
deep-survey instrument are marked by "#''; other values of the
effective-area integrals should be used for them, namely:
100 Å - 1608; 200 Å - 992.
The existence of X-ray flare observations for a star is indicated by "X'' in Col. 34.
Wavelengths of radio observations are presented in Col. 35.
The radio fluxes in mJy (Col. 36) and the radio luminosities
 and
and
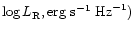 (Col. 37) are
taken from Gibson (1985), Drake & Caillault (1991), Güdel (1992) and
Güdel et al. (1993) and from Bookbinder (1985). The existence of
radio data for flares is indicated in Col. 38 by "R''.
(Col. 37) are
taken from Gibson (1985), Drake & Caillault (1991), Güdel (1992) and
Güdel et al. (1993) and from Bookbinder (1985). The existence of
radio data for flares is indicated in Col. 38 by "R''.
Tables 1, 2 and 3 are only
available in electronic form at the CDS via anonymous ftp to
cdsarc.u-strasbg.fr (130.79.128.5) or via
http://cdsweb.u-strasbg.fr/Abstract.html
Copyright The European Southern Observatory (ESO)