Up: Extended radio emission in
The VLA and WSRT observations detected extended emission around about 85%
of the observed objects; for about 50% of them the flux density of the extended emission we measured is a factor 1.3-3
higher than previously derived from images with lower dynamic range
(Antonucci & Ulvestad 1985;
Antonucci et al. 1986; Murphy et al. 1993;
Kollgaard et al. 1992; Kollgaard et al. 1996).
The WSRT and VLA D-array data were effective on the detection of arc-minute
scale structures, but only in a few cases we observed significant emission at
this scale above a surface brightness of  1 mJy/beam.
The images are shown in Fig. 1 through 34 and the image parameters are reported
in Table 2. More information on this table is given in the caption. For all the images the contour levels are -3,
3, 6, 12, 25, 50,
100, 200, 400, 800, 1500, 3000 times the image rms.
The relevant result for our study is the radio luminosity of the
extended structure, but we have derived other important physical
parameters from the images.
The flux density of the extended emission has been determined by subtracting
the peak from the total flux density, using the most suitable
image, i.e. the image with enough resolution to isolate the core,
but still containing all the extended emission.
To calculate the luminosity we used the luminosity distance obtained from
the redshift. For sources having only a lower limit to the redshift we
used this lower value.
Table 3 contains the flux density and luminosity of the extended emission,
the largest angular and linear size, the core prominence parameter R and the "sidedness'' of the extended emission of the source: 1 if one-sided, 2 if two-sided, P for a pointlike source.
The luminosities were K-corrected by the factor
 ,
where
,
where
 is the spectral index of the
extended structure (S
is the spectral index of the
extended structure (S
 )
and we have used
)
and we have used
 .
In Table 3 we also report the flux densities of the extended emission,
as found in the literature, of the remaining 6 sources from the 1 Jy sample
and of a few sources also observed by us, whenever the measure
found in the literature had a better resolution allowing a more
accurate subtraction of the core emission. When
necessary, the measures have been scaled to 1.36 GHz.
.
In Table 3 we also report the flux densities of the extended emission,
as found in the literature, of the remaining 6 sources from the 1 Jy sample
and of a few sources also observed by us, whenever the measure
found in the literature had a better resolution allowing a more
accurate subtraction of the core emission. When
necessary, the measures have been scaled to 1.36 GHz.
The largest angular and linear sizes have been calculated only for the sources
showing a well defined extended structure. For the one-sided
objects we give the largest angular distance from the core.
The core prominence parameter, R, is defined as the ratio between the core and
the extended emission flux densities, multiplied by
 ,
to apply the K-correction, assuming
,
to apply the K-correction, assuming
 for the core
spectral index.
for the core
spectral index.
In the WSRT images, the cross marks the position
of the subtracted core component.
For 0454+844, 0814+425, 0820+225, 0851+202, 1749+701, 1823+568,
and 2254 +074, observed with the WSRT, and 0823+033 (VLA, D configuration) we
could not evaluate the contribution of the core and the extended components,
due to the relatively low resolution of these arrays; for 0716+714 our measure of the extended emission flux density is lower than that found by
Antonucci et al. (1986) due
to the low resolution of our data. No image is shown for these sources.
We give now a brief description for each source that showed extended
structure and a comparison with previous observations.
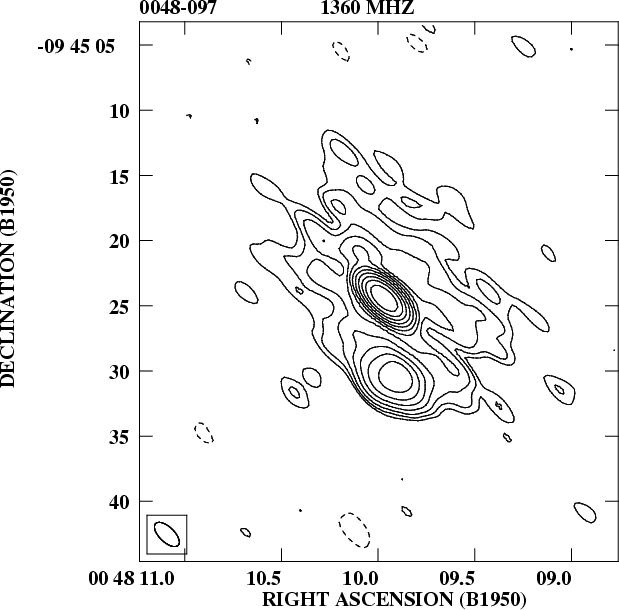
0048-097: Figure 1 shows the A+B configuration image.
The core emission is located at the center of a diffuse structure and a bright
knot (hot-spot?) is seen at the southern edge of the radio source.
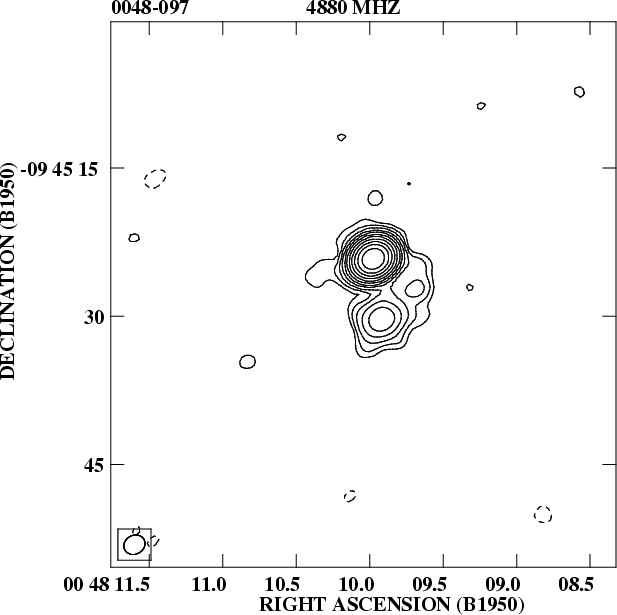
The 4.88 GHz image (Fig. 2) from the B array does not show all the extended
structure seen at lower frequency. The image at 1.46 GHz published by
Wardle et al. (1984) only shows the core and a hint of the southern knot. We find a
flux density of 176 mJy in the extended emission to be compared to the 95 mJy
reported by Antonucci & Ulvestad (1985) based on the image of
Wardle et al. (1984). 0048-097 appears only marginally resolved in our D array data.
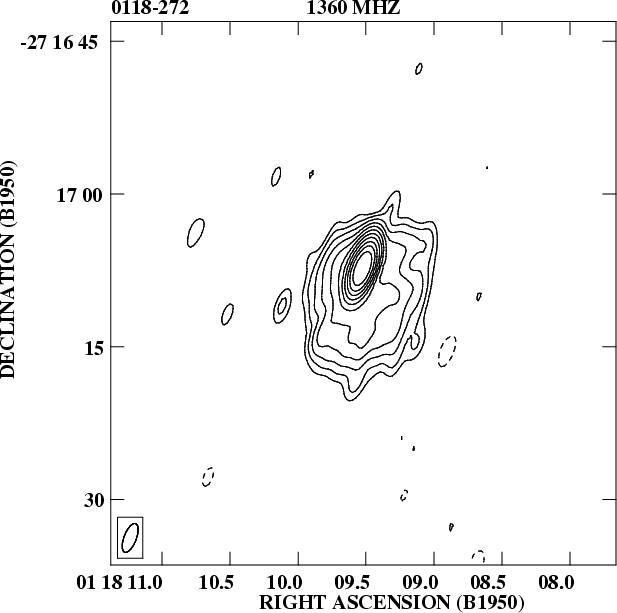
0118-272:
the radio image from the A array (1.36 GHz in Fig. 3) shows a halo around the
core that contributes significantly to the total luminosity, while the B
configuration image (not shown) displays only a marginally resolved structure.
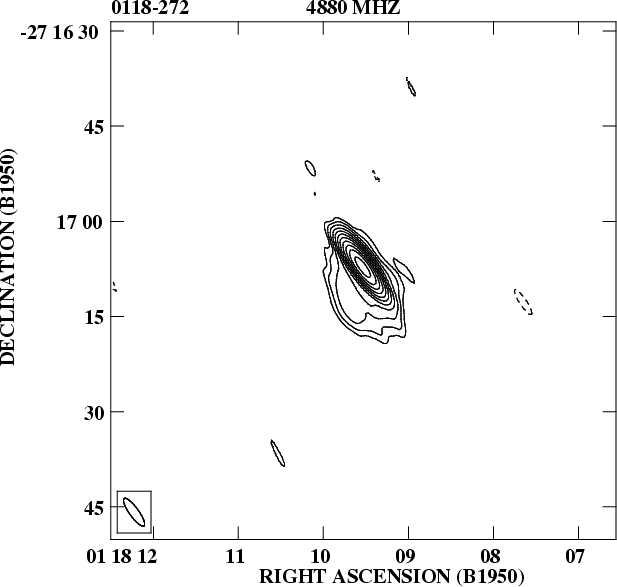
In the image at 4.88 GHz (Fig. 4) there is a hint of a jet extending towards
SE. Previous observations of this source are reported by
Perley (1982).
Our higher dynamic range allows to image the extended emission to larger
distances than in Perley (1982); the diffuse emission in our image extends to 18 arcseconds.
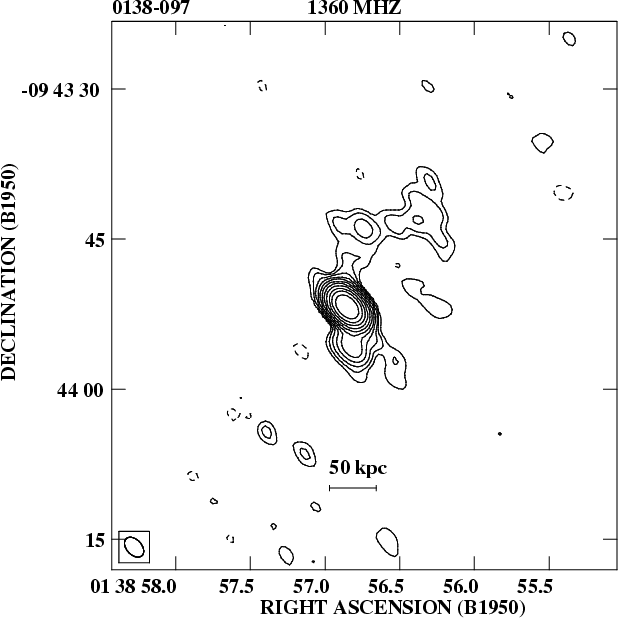
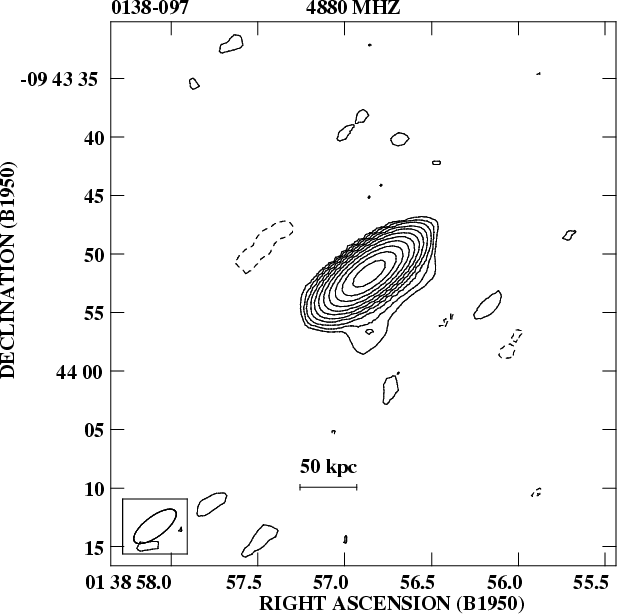
0138-097:
in the combined A and B array data sets at 1.36 GHz (Fig. 5) we see a weak
elongated structure
 |
Figure 1:
0048-097, VLA A+B configuration,
1.36 GHz. The restoring beam is
 arcsec in PA 46
 .
The peak flux density is 511 mJy/beam and the rms noise on the image
is 0.08 mJy/beam .
The peak flux density is 511 mJy/beam and the rms noise on the image
is 0.08 mJy/beam |
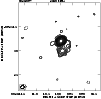 |
Figure 2:
0048-097, VLA B configuration, 4.88 GHz.
The restoring beam is
 arcsec in PA -60.
The peak flux density is 982 mJy/beam and the rms noise on the image is
0.15 mJy/beam
arcsec in PA -60.
The peak flux density is 982 mJy/beam and the rms noise on the image is
0.15 mJy/beam |
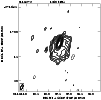 |
Figure 3:
0118-272, VLA A configuration, 1.36 GHz.
The restoring beam is
 arcsec in PA -21.
The peak flux density is 742 mJy/beam and the rms noise on the image is
0.10 mJy/beam
arcsec in PA -21.
The peak flux density is 742 mJy/beam and the rms noise on the image is
0.10 mJy/beam |
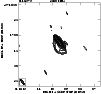 |
Figure 4:
0118-272, VLA B configuration, 4.88 GHz.
The restoring beam is
 arcsec in PA 36.
The peak
flux density is 663 mJy/beam and the rms noise on the image is 0.15 mJy/beam
arcsec in PA 36.
The peak
flux density is 663 mJy/beam and the rms noise on the image is 0.15 mJy/beam |
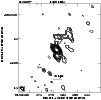 |
Figure 5:
0138-097, VLA A+B configuration, 1.36 GHz.
The restoring beam is
 arcsec in PA 42.
The peak flux density is 541 mJy/beam and the rms noise on the image is
0.07 mJy/beam
arcsec in PA 42.
The peak flux density is 541 mJy/beam and the rms noise on the image is
0.07 mJy/beam |
 |
Figure 6:
0138-097, VLA B configuration, 4.88 GHz.
The restoring beam is
 arcsec in PA -53.
The peak flux density is 695 mJy/beam and the rms noise on the image is
0.15 mJy/beam
arcsec in PA -53.
The peak flux density is 695 mJy/beam and the rms noise on the image is
0.15 mJy/beam |
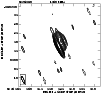 |
Figure 6:
0426-380, VLA A configuration, 1.36 GHz.
The restoring beam is
 arcsec in PA 23.
The peak flux density is 624 mJy/beam and the rms noise on the image is
0.10 mJy/beam
arcsec in PA 23.
The peak flux density is 624 mJy/beam and the rms noise on the image is
0.10 mJy/beam |
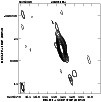 |
Figure 7:
0426-380, VLA B configuration, 4.88 GHz.
The restoring beam is 5.3x1.4 arcsec in PA 15.
The peak flux
density is 1371 mJy/beam and the rms noise on the image is 0.15 mJy/beam |
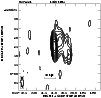 |
Figure 8:
0537-441, VLA A configuration, 1.36 GHz.
The restoring beam is
 arcsec in PA 1.
The peak flux density is 3010 mJy/beam and the rms noise on the image is 0.50 mJy/beam arcsec in PA 1.
The peak flux density is 3010 mJy/beam and the rms noise on the image is 0.50 mJy/beam |
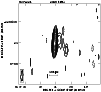 |
Figure 10:
0537-441, VLA B configuration,
4.88 GHz. The restoring beam is
 arcsec in PA -3.
The peak flux density is 5138 mJy/beam and the rms noise on the image is 1.80 mJy/beam arcsec in PA -3.
The peak flux density is 5138 mJy/beam and the rms noise on the image is 1.80 mJy/beam |
 |
Figure 11:
0828+493, VLA B configuration, 1.40 GHz
(from FIRST, Becker et al. 1995). The restoring beam is
 arcsec. The peak flux density is 355 mJy/beam and
the rms noise on
the image is 0.13 mJy/beam arcsec. The peak flux density is 355 mJy/beam and
the rms noise on
the image is 0.13 mJy/beam |
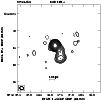 |
Figure 12:
0954+658, VLA A configuration, 1.36 GHz.
The restoring beam is
 arcsec in PA 34.
The peak flux density
is 597 mJy/beam and the rms noise on the image is 0.08 mJy/beam
arcsec in PA 34.
The peak flux density
is 597 mJy/beam and the rms noise on the image is 0.08 mJy/beam |
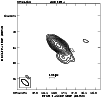 |
Figure 13:
0954+658, VLA B configuration, 4.88 GHz.
The restoring beam is
 arcsec in PA 49.
The peak flux density is 523 mJy/beam and the rms noise on the image is 0.15 mJy/beam
arcsec in PA 49.
The peak flux density is 523 mJy/beam and the rms noise on the image is 0.15 mJy/beam |
 |
Figure 14:
1144-379, VLA A configuration, 1.36 GHz. The
restoring beam is
 arcsec in PA -9.
The peak flux density is 21 mJy/beam and the rms noise on the image is 0.5 mJy/beam arcsec in PA -9.
The peak flux density is 21 mJy/beam and the rms noise on the image is 0.5 mJy/beam |
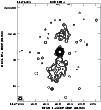 |
Figure 15:
1147+245, VLA A+B configuration, 1.36 GHz.
The restoring beam is
 arcsec.
The peak flux density is 796 mJy/beam and the rms noise on the image is 0.07 mJy/beam
arcsec.
The peak flux density is 796 mJy/beam and the rms noise on the image is 0.07 mJy/beam |
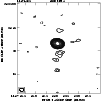 |
Figure 16:
1147+245, VLA B configuration, 4.88 GHz. The
restoring beam is
 arcsec in PA 82.
The peak flux
density is 845 mJy/beam and the rms noise on the image is 0.10 mJy/beam
arcsec in PA 82.
The peak flux
density is 845 mJy/beam and the rms noise on the image is 0.10 mJy/beam |
 |
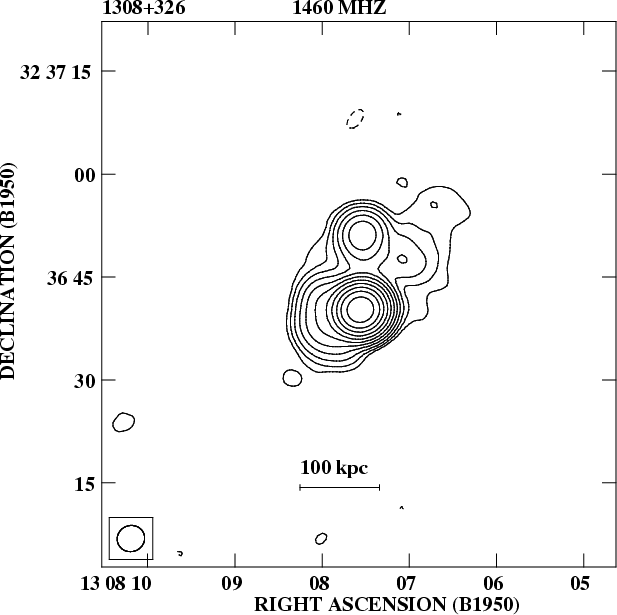
Figure 17:
1308+326, VLA B configuration, 1.46 GHz.
The restoring beam is
 arcsec. The peak flux density is
859 mJy/beam and the rms noise on the image is 0.15 mJy/beam
arcsec. The peak flux density is
859 mJy/beam and the rms noise on the image is 0.15 mJy/beam |
 |
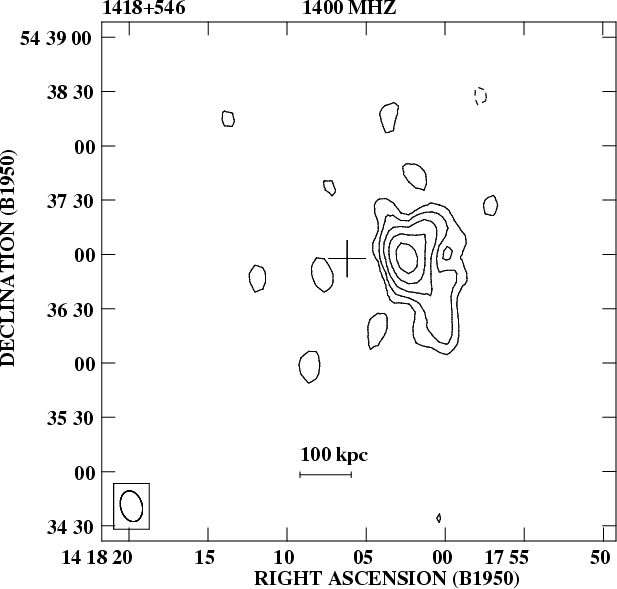
Figure 18:
1418+546, VLA B configuration, 1.40 GHz
(from FIRST, Becker et al. 1995). The restoring beam is
arcsec. The peak flux density is 566 mJy/beam and
the rms noise
on the image is 0.15 mJy/beam |
 |
Figure 19:
1418+546, WSRT, 1.40 GHz. The restoring beam is
 arcsec in PA 14.
The peak flux density is 19 mJy/beam and
the rms noise on the image is 0.25 mJy/beam
arcsec in PA 14.
The peak flux density is 19 mJy/beam and
the rms noise on the image is 0.25 mJy/beam |
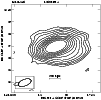 |
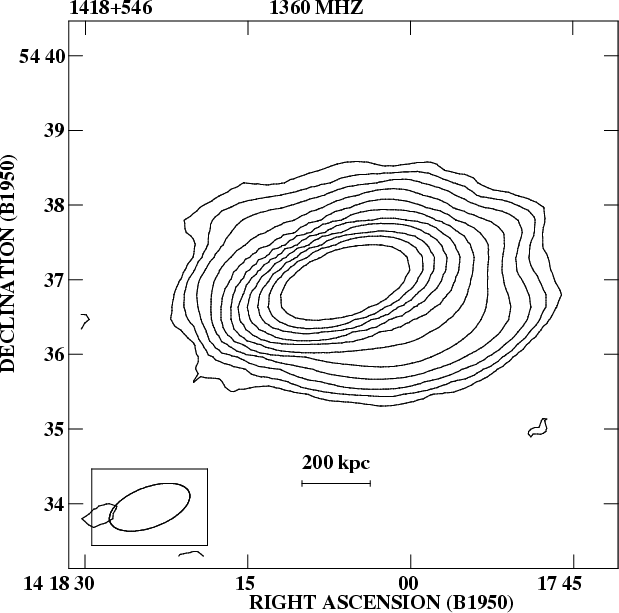
Figure 20:
1418+546, VLA D configuration, 1.36 GHz. The
restoring beam is
 arcsec in PA -69.
The peak flux density
is 815 mJy/beam and the rms noise on the image is 0.07 mJy/beam
arcsec in PA -69.
The peak flux density
is 815 mJy/beam and the rms noise on the image is 0.07 mJy/beam |
 |
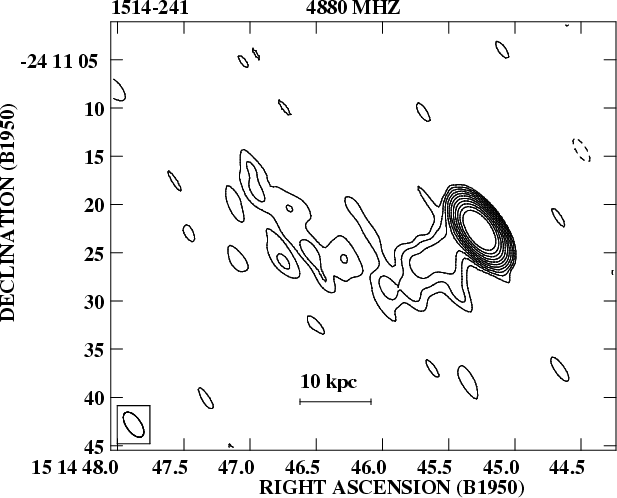
Figure 21:
1514-241, VLA A+B configuration, 1.36 GHz.
The restoring beam is
 arcsec in PA 28.
The peak flux
density is 1625 mJy/beam and the rms noise on the image is 0.15 mJy/beam
arcsec in PA 28.
The peak flux
density is 1625 mJy/beam and the rms noise on the image is 0.15 mJy/beam |
 |
Figure 22:
1514-241, VLA B configuration, 4.88 GHz.
The restoring beam is
 arcsec in PA -50.
The peak
flux density is 2918 mJy/beam and the rms noise on the image is
0.17 mJy/beam
arcsec in PA -50.
The peak
flux density is 2918 mJy/beam and the rms noise on the image is
0.17 mJy/beam |
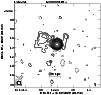 |
Figure 23:
1514-241, VLA D configuration, 1.40 GHz
(from NVSS, Condon et al. 1998). The restoring beam is
 arcsec.
The peak flux density is 1993 mJy/beam and the rms noise
on the image is 0.40 mJy/beam arcsec.
The peak flux density is 1993 mJy/beam and the rms noise
on the image is 0.40 mJy/beam |
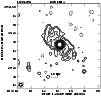 |
Figure 24:
1652+398, VLA B configuration, 1.36 GHz.
The restoring beam is
 arcsec in PA -84.
The peak flux
density is 1383 mJy/beam and the rms noise on the image is 0.13 mJy/beam
arcsec in PA -84.
The peak flux
density is 1383 mJy/beam and the rms noise on the image is 0.13 mJy/beam |
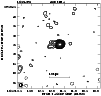 |
Figure 25:
1652+398, VLA B configuration, 4.88 GHz.
The restoring beam is
 arcsec in PA -76.
The peak flux
density is 1320 mJy/beam and the rms noise on the image is 0.18 mJy/beam
arcsec in PA -76.
The peak flux
density is 1320 mJy/beam and the rms noise on the image is 0.18 mJy/beam |
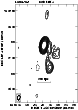 |
Figure 26:
1803+784, VLA B configuration, 1.36 GHz.
The restoring beam is
 arcsec in PA -11.
The peak flux density is 1761 mJy/beam and the rms noise on the
image is 0.07 mJy/beam
arcsec in PA -11.
The peak flux density is 1761 mJy/beam and the rms noise on the
image is 0.07 mJy/beam |
 |
Figure 27:
1807+698, VLA A+B+D configuration, 1.36 GHz.
The restoring beam is
 arcsec in PA -22.
The peak flux
density is 1284 mJy/beam and the rms noise on the image is 0.10 mJy/beam
arcsec in PA -22.
The peak flux
density is 1284 mJy/beam and the rms noise on the image is 0.10 mJy/beam |
 |
Figure 28:
1807+698, VLA A configuration, 1.36 GHz.
The restoring beam is
 arcsec in PA -49.
The peak flux density is 1136 mJy/beam and the rms noise on the image
is 0.15 mJy/beam
arcsec in PA -49.
The peak flux density is 1136 mJy/beam and the rms noise on the image
is 0.15 mJy/beam |
 |
Figure 29:
1807+698, VLA B configuration, 4.88 GHz.
The restoring beam is
 arcsec in PA -9.
The peak flux density is 1507 mJy/beam and the rms noise on the image is
0.15 mJy/beam
arcsec in PA -9.
The peak flux density is 1507 mJy/beam and the rms noise on the image is
0.15 mJy/beam |
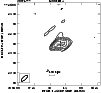 |
Figure 30:
2007+777, WSRT, 1.40 GHz. The restoring beam
is
 arcsec in PA -47.
The peak flux density is 17 mJy/beam
and the rms noise on the image is 0.25 mJy/beam
arcsec in PA -47.
The peak flux density is 17 mJy/beam
and the rms noise on the image is 0.25 mJy/beam |
 |
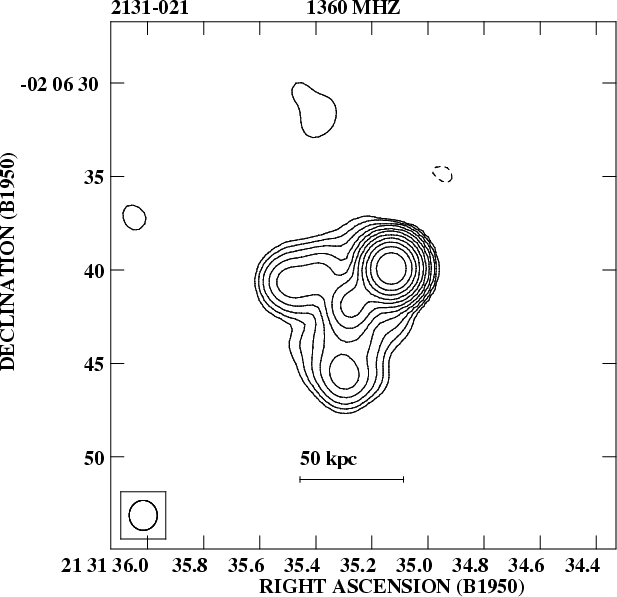
Figure 31:
2131-021, VLA A configuration, 1.36 GHz.
The restoring beam is
 arcsec in PA 1.
The peak flux
density is 1291 mJy/beam and the rms noise on the image is 0.20 mJy/beam
arcsec in PA 1.
The peak flux
density is 1291 mJy/beam and the rms noise on the image is 0.20 mJy/beam |
 |
Figure 32:
2131-021, VLA B configuration, 4.88 GHz.
The restoring beam is
 arcsec in PA -22.
The peak flux density
is 982 mJy/beam and the rms noise on the image is 0.20 mJy/beam
arcsec in PA -22.
The peak flux density
is 982 mJy/beam and the rms noise on the image is 0.20 mJy/beam |
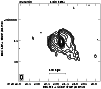 |
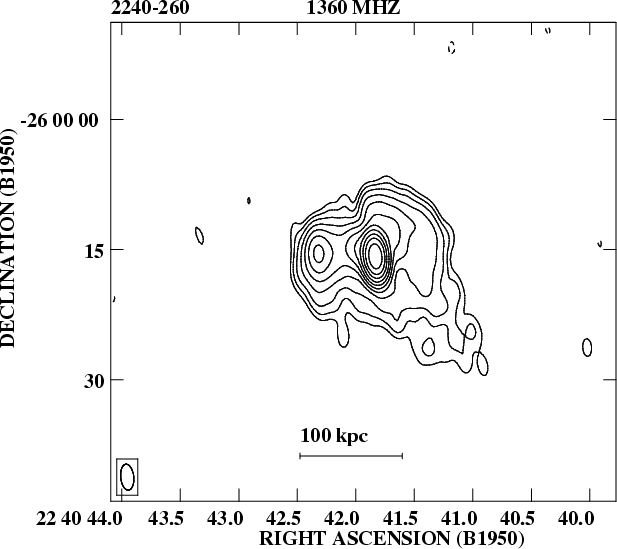
Figure 33:
2240-260, VLA A configuration, 1.36 GHz.
The restoring beam is
 arcsec in PA 6.
The peak
flux density is 813 mJy/beam and the rms noise on the image is 0.08 mJy/beam
arcsec in PA 6.
The peak
flux density is 813 mJy/beam and the rms noise on the image is 0.08 mJy/beam |
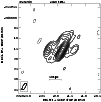 |
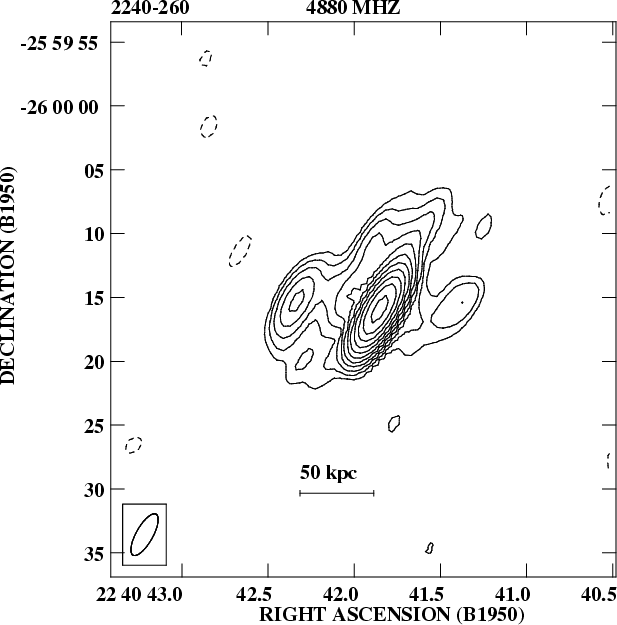
Figure 34:
2240-260, VLA B configuration, 4.88 GHz.
The restoring beam is
 arcsec in PA -29.
The peak flux density
is 805 mJy/beam and the rms noise on the image is 0.20 mJy/beam
arcsec in PA -29.
The peak flux density
is 805 mJy/beam and the rms noise on the image is 0.20 mJy/beam |
 |
Figure 35:
Numeric distribution of the radio luminosity of
the extended emission at 1.36 GHz for the 1 Jy sample, as from Table 3. The
symbol ">'' is a lower limit to the luminosity, as derived from the
minimum redshift. When the radio luminosity could not be determined
with enough accuracy (0823+033, 0828+493 and 1144-379, see text), we
used the symbol "?'' to remark the uncertain estimate |
leading to the NW and a rather bright component
extending approximately 4'' south of the core. The 4.88 GHz image (Fig. 6) does
not show clear secondary components, maybe just a clue of the southern one.
The source is point-like in the D array image. Previous observations
(Perley 1982) do not reveal any extended structure in this source.
Table 3:
Observational data of the whole 1 Jy sample. The question marks
in Cols. [2] through [7] indicate
indicate a very uncertain value. Column [1] IAU name; [2] red shift:
Stickel et al. (1993) for all sources but 0138-097 and 0454+844
(Stocke & Rector 1997), 0814+425 (Falomo et al. 1997) and 2131-021
(Drinkwater et al. 1997); [3] extended flux, where necessary scaled to
1.36 GHz; [4] Log of extended luminosity; [5] maximum diameter of the
source in arcsec and [6] in kpc; [7] ratio core/extended flux density;
[8] sidedness: "1'' one-sided extended emission, "2'' double-sided
extended emission, "P'' unresolved or barely resolved
source; [9] references for the information given in this table: 1) this paper,
2) Murphy et al. (1993),
3) Antonucci et al. (1996), 4) Antonucci & Ulvestad (1995), 5)
Kollgaard et al. (1992),
6) Perlman & Stocke (1994), 7) FIRST survey
| [1] |
[2] |
[3] |
[4] |
[5] |
[6] |
[7] |
[8] |
[9] |
|
Name |
z |
 |
Log
 |
LAS |
Size |
R |
S |
Ref. |
| |
|
(mJy) |
(W Hz-1) |
(arcsec) |
(kpc) |
|
|
|
|
0048-097 |
>0.2 |
176 |
>25.50 |
24 |
>101 |
<2.5 |
1 |
1 |
| 0118-272 |
>0.557 |
168 |
>26.40 |
18 |
>133 |
<3.0 |
1 |
1 |
| 0138-097 |
0.733 |
50 |
26.13 |
23 |
186 |
6.8 |
2 |
1 |
| 0235+164 |
0.940 |
36 |
26.21 |
13 |
110 |
18.2 |
1 |
2 |
| 0426-380 |
>1.030 |
86 |
>26.67 |
6 |
>51 |
<4.1 |
1 |
1 |
| 0454+844 |
>1.34 |
... |
... |
... |
... |
... |
... |
... |
| 0537-441 |
0.896 |
220 |
26.95 |
13 |
109 |
8.2 |
1 |
1 |
| 0716+714 |
>0.2 |
387 |
>25.85 |
18 |
>76 |
<0.87 |
1 |
3 |
| 0735+178 |
>0.424 |
24 |
>25.31 |
10 |
>66 |
<70.0 |
1 |
2 |
| 0814+425 |
>0.6 |
76 |
>26.12 |
6 |
>46 |
16.8 |
1 |
2 |
| 0820+225 |
0.951 |
700 |
27.51 |
12 |
101 |
1.3 |
1 |
2 |
| 0823+033 |
0.506? |
5 |
24.79? |
18 |
129? |
191.0 |
1 |
2 |
| 0828+493 |
0.548? |
25 |
25.56? |
42 |
331? |
10.0 |
2 |
7 |
| 0851+202 |
0.306 |
17 |
24.87 |
28 |
156 |
81.6 |
1 |
6 |
| 0954+658 |
0.367 |
34 |
25.33 |
6 |
37 |
14.7 |
1 |
1 |
| 1144-379 |
1.048 |
10? |
25.75? |
1? |
8? |
106.5? |
P |
1 |
| 1147+245 |
>0.2 |
50 |
>24.96 |
34 |
>144 |
<13.7 |
2 |
1 |
| 1308+326 |
0.997 |
105 |
26.73 |
31 |
264 |
4.7 |
1 |
1 |
| 1418+546 |
0.152 |
47 |
24.69 |
75 |
259 |
13.5 |
1 |
1 |
| 1514-241 |
0.049 |
210 |
24.34 |
270 |
354 |
7.4 |
1 |
1 |
| 1519-273 |
>0.2 |
... |
... |
... |
... |
... |
P |
1 |
| 1538+149 |
0.605 |
234 |
26.62 |
7 |
53 |
4.5 |
1 |
2 |
| 1652+398 |
0.033 |
95 |
23.65 |
75 |
68 |
14.2 |
2 |
1 |
| 1749+096 |
0.320 |
... |
... |
... |
... |
... |
... |
... |
| 1749+701 |
0.770 |
12 |
25.55 |
3 |
24 |
32.2 |
? |
5 |
| 1803+784 |
0.684 |
43 |
26.00 |
56 |
444 |
27.0 |
1 |
1 |
| 1807+698 |
0.051 |
1010 |
25.06 |
222 |
302 |
1.2 |
2 |
1 |
| 1823+568 |
0.664 |
525 |
27.06 |
25 |
196 |
1.3 |
? |
2 |
| 2005-489 |
0.071 |
... |
... |
... |
... |
... |
... |
... |
| 2007+777 |
0.342 |
41 |
25.35 |
28a |
166a |
21.1 |
2a |
1 |
| 2131-021 |
1.285 |
182 |
27.20 |
9 |
77 |
3.7 |
1 |
1 |
| 2200+420 |
0.069 |
40 |
23.92 |
15 |
27 |
78.4 |
1 |
4 |
| 2240-260 |
0.774 |
333 |
26.99 |
26 |
212 |
1.6 |
2 |
1 |
| 2254+074 |
0.190 |
17 |
24.44 |
18 |
73 |
23.2 |
1 |
4 |
|
Note:
a. Value calculated from the image of Murphy et al. (1993). |
We remark that recent optical observations by Heidt et al. (1996)
and Scarpa et al. (1999) show a number of companions within 3 arcsec from the
BL Lac. The extended radio emission in Fig. 5 is aligned with the
position of these companions.
We cannot rule out that at least part of the extended radio emission
we report in Table 3 is associated with any of these structures.
0426-380:
this source has a short jet pointing to the NW visible only in
the higher resolution images (Figs. 7 and 8).
We find a flux density of the extended emission twice the value reported by
Perley (1982).
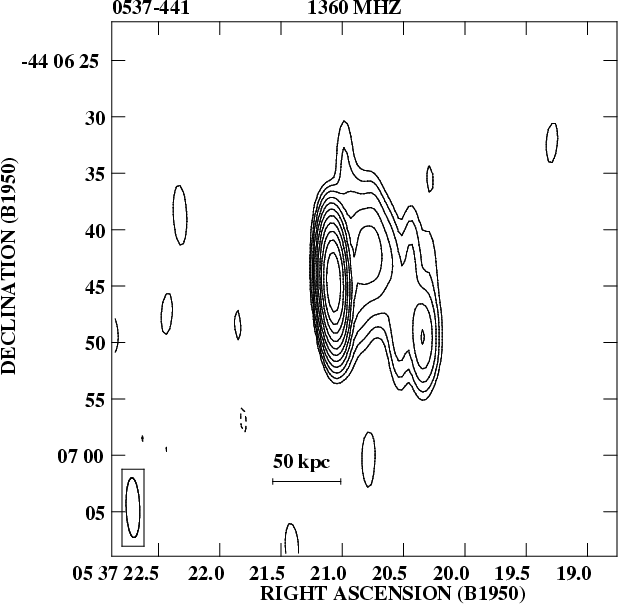
0537-441:
the low declination of the source resulted in a very elongated beam in N-S.
Nevertheless in our highest resolution image (Fig. 9, A array, 1.36 GHz)
0537-441 shows a curved jet-like structure leading to the west.
The radio source is slightly resolved also in the B array image at the same
wavelength (not shown).
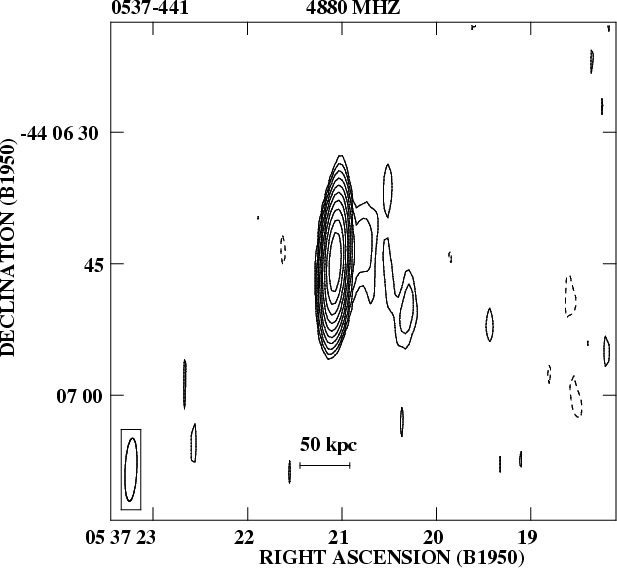
The jet has been also detected at 4.88 GHz, but its surface brightness is
lower (Fig. 10). Perley (1982) detects only the knot at the end of the jet.
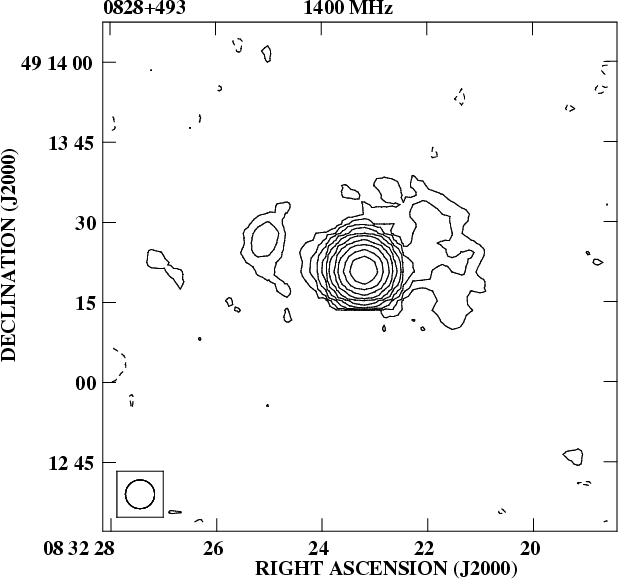
0828+493:
no extended emission has been detected for this source either in our WSRT
image or in previous VLA observations (Murphy et al. 1993).
However, some extended emission has been recently revealed by the FIRST survey. We used this image (Fig. 11) to derive the numbers in Table 3.
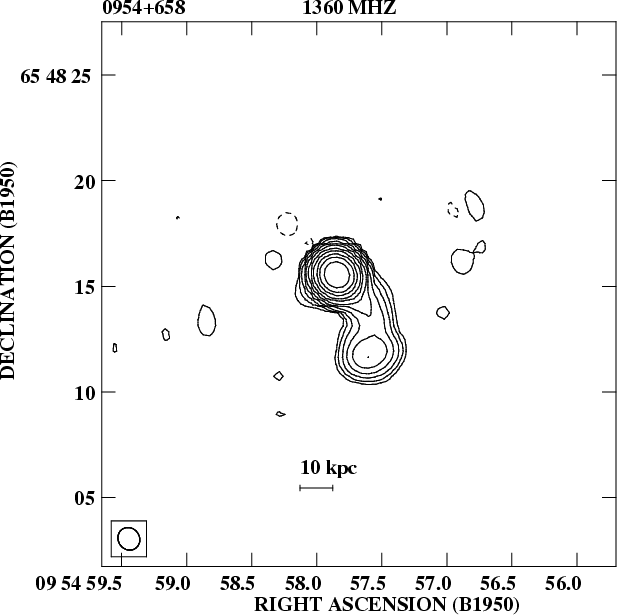
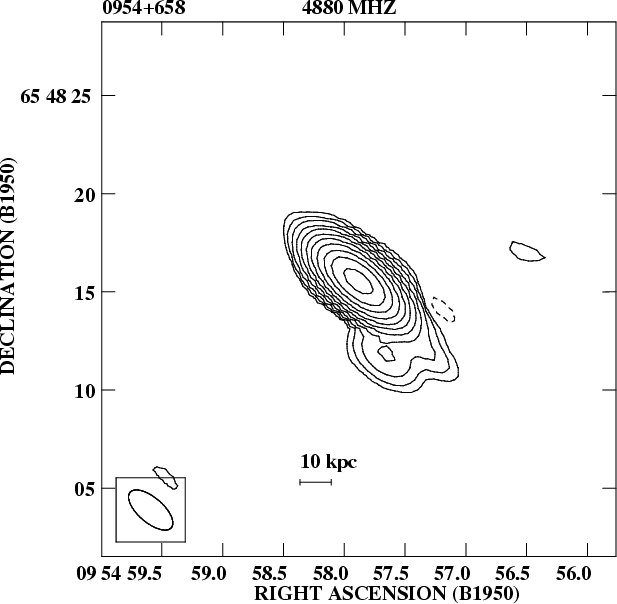
0954+658:
Kollgaard et al. (1992) detect a jet extending approximately 5'' to the South.
Our A array image at 1.36 GHz (Fig. 12) and the 4.88 GHz B array image (Fig. 13) show an elongated structure directed to the SW and then bending to
the south. No further extended emission has been detected in our B and D
array data at 1.36 GHz.
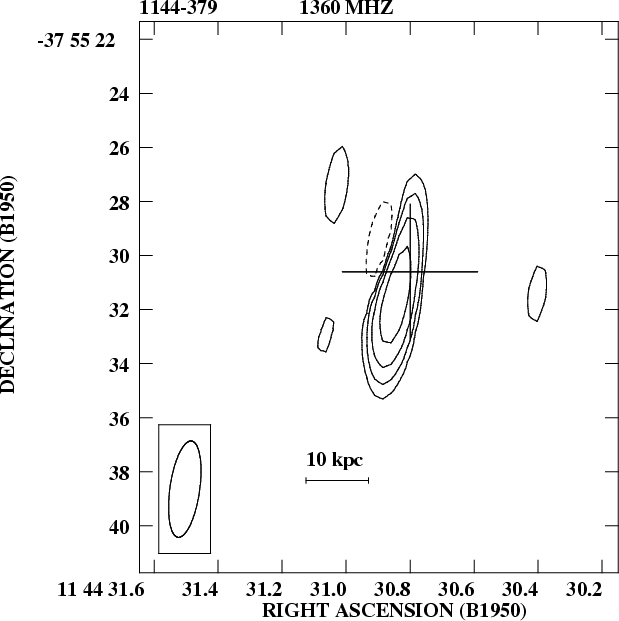
1144-379:
the radio image in the L band is dominated by an unresolved component of 1.9 Jy.
Perley (1982) reports an upper limit of 10 mJy for any extended emission.
The sources 1144-379 is barely resolved even in the VLA A
array images.
A coarse estimate of the extended flux, through fitting the radio source with
a point-like component and determining the residuals, gives a value of
about 20 mJy.
In Fig. 14 we show the VLA image in which the arcsecond core
has not been restored (its position is marked by a cross). Given the low
declination of the source, the uv-coverage is not adequate to allow a proper
imaging of this additional component.
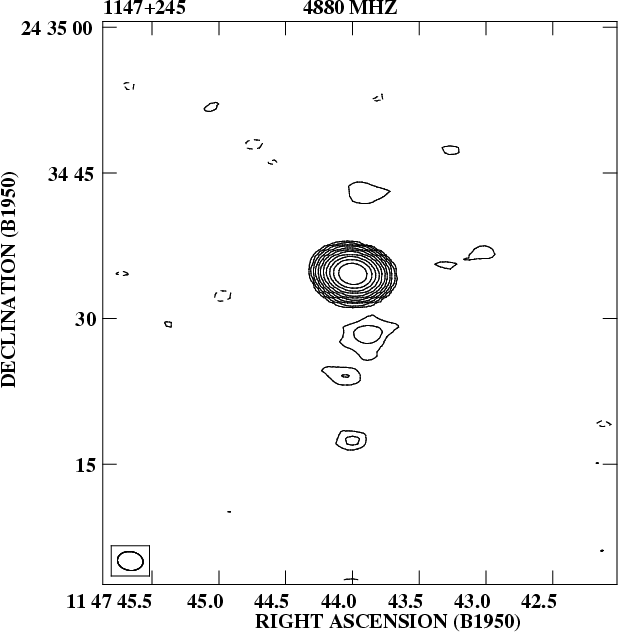
1147+245:
we detect a diffuse component up to 15'' to the South and another diffuse
component located about 10'' on the opposite
side of the core (Fig. 15), basically in agreement with the image published
by Antonucci & Ulvestad (1985). Our measure of the extended emission flux
density is about twice their value. In the 4.88 GHz image (Fig. 16) only
hints of the extended structures are visible.
1308+326:
The VLA data of this source are from a different program, in which 1308+326
was observed as secondary calibrator.
This source shows a dominant component which is resolved in the SE direction,
a secondary component 12'' north, and a diffuse halo surrounding the
entire structure (Fig. 17). Murphy et al. (1993) resolve the southern diffuse
emission in a structure suggesting a helical jet. Our B array image reveals
 more flux density in the extended structure than reported by Murphy et al. (1993).
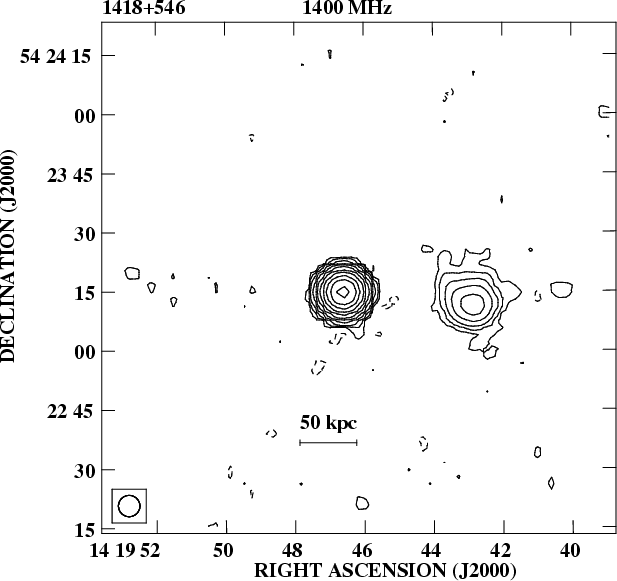
1418+546:
Murphy et al. (1993) found a component to the West of the compact core also
present in the image from the FIRST survey (Fig. 18). Our WSRT observations
(Fig. 19) show that this component is elongated to the south,
with an extended flux density higher than
reported by Murphy et al. or revealed by the FIRST image. The low
resolution D array
image (Fig. 20) is dominated by a point-like component; however extended
and diffuse emission is detected all around, suggesting the presence of
a halo with a total size of 4.5 arcmin similar to that observed in
1807+698 (see below).
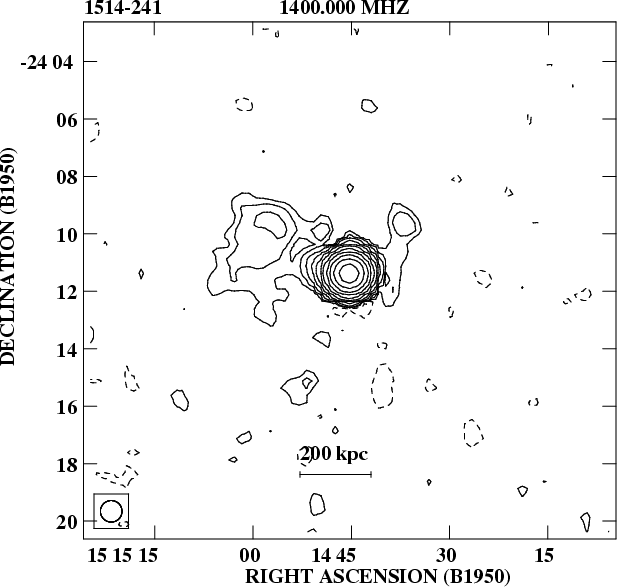
1514-241:
Antonucci & Ulvestad (1985) report a component 21'' away from the core.
Our A+B array image at 1.36 GHz shows a jet emerging
along the SE direction and bending towards NE after a dozen of arcseconds, for
a total extent  (Fig. 21), also visible in the 4.88 GHz
image (Fig. 22). The image from the D array (Fig. 23) was obtained from the
NVSS survey (Condon et al. 1998), and clearly shows a diffuse
emission on the arcmin scale on the same side of the jet.
The flux density of this component was added to the estimate from our A+B
array image.
(Fig. 21), also visible in the 4.88 GHz
image (Fig. 22). The image from the D array (Fig. 23) was obtained from the
NVSS survey (Condon et al. 1998), and clearly shows a diffuse
emission on the arcmin scale on the same side of the jet.
The flux density of this component was added to the estimate from our A+B
array image.
1519-273:
this is a very compact source, unresolved in our images at the resolution of
1''. The source is still unresolved at the mas scale (O'Dea et al. 1991;
Shen et al. 1997). Perley (1982) gives an upper limit of about 5 mJy for any
extended emission.
We did
not detect significant extended
emission above 0.5 mJy/beam, and we do not show any image for this
source.
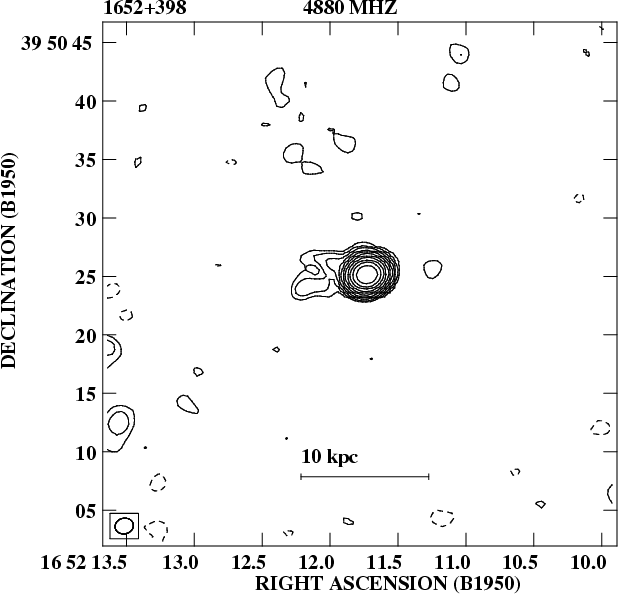
1652+398: Kollgaard et al. (1992) find
a diffuse emission at 5 GHz which is in agreement with the 75'' wide halo we
detect in our higher resolution
B array image at 1.36 GHz (Fig. 24). Our 4.88 image shows instead only
a small fraction of the extended emission visible in the L band.
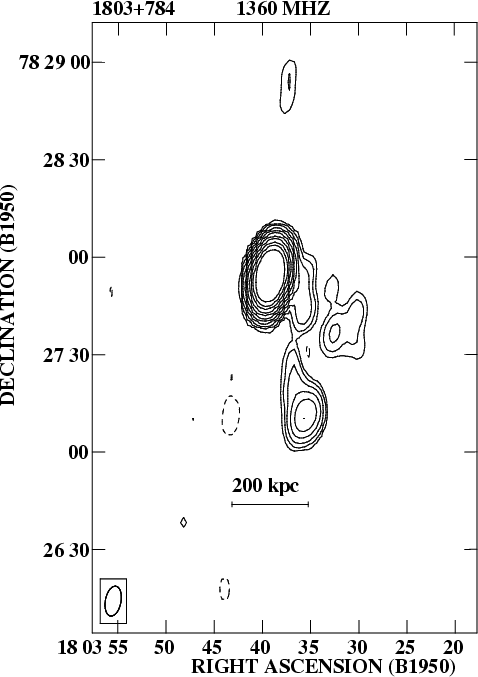
1803+784:
Kollgaard et al. (1992) find a weak component 45'' away from the core, while
Antonucci et al. (1986) detect a diffuse emission around the core.
In our image (Fig. 26) a jet-like structure is present connecting the
secondary component to the core, and additional diffuse emission on the west
side.
The 4.88 GHz image (not reported) shows only an unresolved core.
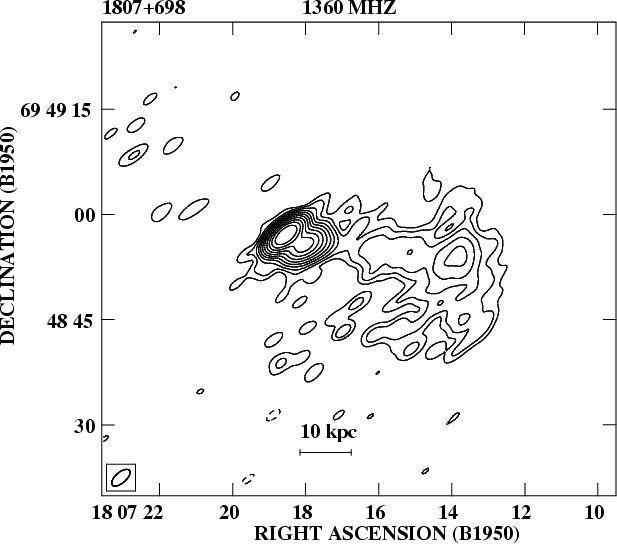
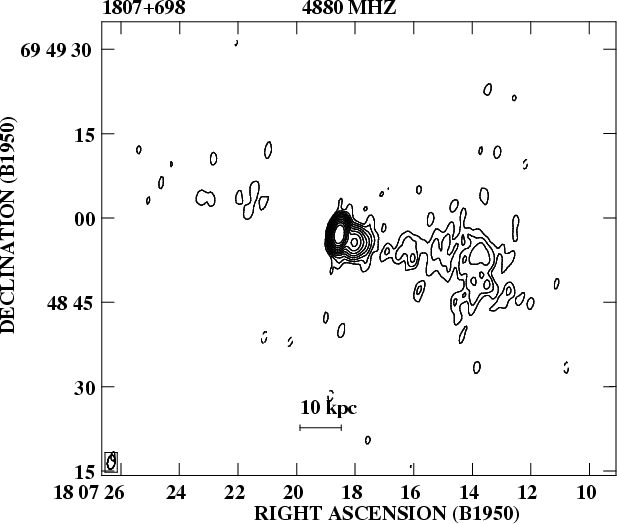
1807+698:
Kollgaard et al. (1996) find the radio structure of this source, at arcsecond
resolution, consisting of a 30'' long jet extending from
the core to the west direction. Wrobel & Lind (1990) find a double lobed structure of total extension of  ,
at 4.88 GHz (VLA, B configuration).
Our image from A+B+D configuration (Fig. 27) shows a diffuse halo of
220'' of extension surrounding the core-jet structure in agreement with the morphology seen by
Wrobel & Lind (1990).
The jet is clearly visible in our A array image at 1.36 GHz (Fig. 28) and in
the B array 4.88 GHz image (Fig. 29).
,
at 4.88 GHz (VLA, B configuration).
Our image from A+B+D configuration (Fig. 27) shows a diffuse halo of
220'' of extension surrounding the core-jet structure in agreement with the morphology seen by
Wrobel & Lind (1990).
The jet is clearly visible in our A array image at 1.36 GHz (Fig. 28) and in
the B array 4.88 GHz image (Fig. 29).
2007+777:
the WSRT image has not enough resolution to characterize the
extended structure, which is better highlighted by the VLA observations of
Murphy et al. (1993). However the total flux density of the extended emission
in our WSRT image exceeds the measure from Murphy et al. by about 30%
(Fig. 30).
2131-021:
the unresolved core is located at the NW edge of the radio emission
(Fig. 31). Two jet like structures are oriented in PA  90
and PA 170;
all this is reminiscent of NAT/WAT morphology.
The B array image at 1.36 GHz does not reveal any further extended emission
and we can therefore consider that the total angular size of the extended
radio emission is about 9''. Observations of this source were made by
Perley (1982) and he found an extended flux of about 50 mJy.
Recently a VLA image in B configuration at 1.49 GHz was published by
Hutchings et al. (1998). The lower resolution of their observations did not
allow to properly separate the core flux density from the tail-shaped extended
emission yielding to underestimate the total extended flux density.
90
and PA 170;
all this is reminiscent of NAT/WAT morphology.
The B array image at 1.36 GHz does not reveal any further extended emission
and we can therefore consider that the total angular size of the extended
radio emission is about 9''. Observations of this source were made by
Perley (1982) and he found an extended flux of about 50 mJy.
Recently a VLA image in B configuration at 1.49 GHz was published by
Hutchings et al. (1998). The lower resolution of their observations did not
allow to properly separate the core flux density from the tail-shaped extended
emission yielding to underestimate the total extended flux density.
2240-260:
in this object the unresolved core sits in the center of a diffuse extended
emission which can be characterized by two misaligned and bent jet-like
structures (Fig. 33). The total size of the extended emission is about 26''
corresponding to 212 kpc at the redshift of the host galaxy.
No previous arcsecond scale observations have been found in the literature.
Up: Extended radio emission in
Copyright The European Southern Observatory (ESO)