
Up: Fifteen years monitoring of
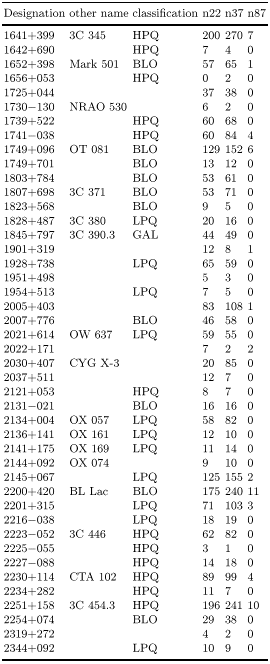
The list of sources with classification and number of observations at each
frequency is shown in Table 3. In the source classification HPQ states that
the source has been recorded at least once an optical polarization level
equal or above 3.0%, for the LPQ type sources the polarization level has
allways been below 3.0%. BL Lac type object are identified with BLO and
galaxies with GAL. Sources with no classification have no optical
polarization observation from the literature or have simply no optical
counterpart like NRAO 150. Due to the large number of data points (over
13000), the numerical tables are available only in electronic form at the
CDS via anonymous ftp. The data in Table 4 consists of date (year, month,
day and hour(ut)) and the flux (Jy) and 1 sigma error estimate (Jy). There
are 157 sources in Table 4, from which about 85 belong to our main sample.
Some additional sources have also been observed during many multifrequency
campaigns, but that data will be published elsewhere. The flux curves for
the 44 best observed sources are given in Fig. 1. The numerical
values for some sources during 1988 and 1989 in Fig. 1 are found in
Wiren et al. (1992). The flux curves in the figures
contain the whole 15 year span of our observations. The numerical values for
the observations prior 1990.5 can be found in Salonen et al.
(1987), Teräsranta et al. (1987) and
Teräsranta et al. (1992). The flux densities in
Fig. 1 are weekly mean values to allow an easier examination of
the flux development. For many sources there are long periods of daily
observations, which can be found in Table 4.
Generally the sources seem to vary on these frequencies on a monthly basis,
the shorter variations are usually within the error bars. In some cases,
like in 0202+149, there was one considerably higher flux point. When
combined with another observation within a week for the figure it produced a
giant error bar. Another example is in OL 093 where we also had an anomalous
high value. These have been carefully checked and as no fault was found they
remain in the database. At our highest observing frequency (87 GHz), the
poor antenna surface accuracy prior to summer 1994 limited the observations
to only a few sessions.
![\begin{figure}
{
\includegraphics [width=13cm]{H0892f01.ps}
}\end{figure}](/articles/aas/full/1998/18/h0892/Timg14.gif)
![\begin{figure}
{
\includegraphics [width=13cm]{H0892f02.ps}
}\end{figure}](/articles/aas/full/1998/18/h0892/Timg15.gif)
![\begin{figure}
{
\includegraphics [width=13cm]{H0892f03.ps}
}\end{figure}](/articles/aas/full/1998/18/h0892/Timg16.gif)
Figure 1:
Weekly mean flux density of observed sources at 22 and 37 GHz
![\begin{figure}
{
\includegraphics [width=13cm]{H0892f04.ps}
}\end{figure}](/articles/aas/full/1998/18/h0892/Timg17.gif)
![\begin{figure}
{
\includegraphics [width=13cm]{H0892f05.ps}
}\end{figure}](/articles/aas/full/1998/18/h0892/Timg18.gif)
![\begin{figure}
{
\includegraphics [width=13cm]{H0892f06.ps}
}\end{figure}](/articles/aas/full/1998/18/h0892/Timg19.gif)
Figure 1:
continued
![\begin{figure}
{
\includegraphics [width=13cm]{H0892f07.ps}
}\end{figure}](/articles/aas/full/1998/18/h0892/Timg20.gif)
![\begin{figure}
{
\includegraphics [width=13cm]{H0892f08.ps}
}\end{figure}](/articles/aas/full/1998/18/h0892/Timg21.gif)
![\begin{figure}
{
\includegraphics [width=13cm]{H0892f09.ps}
}\end{figure}](/articles/aas/full/1998/18/h0892/Timg22.gif)
Figure 1:
continued
![\begin{figure}
{
\includegraphics [width=13cm]{H0892f10.ps}
}\end{figure}](/articles/aas/full/1998/18/h0892/Timg23.gif)
![\begin{figure}
{
\includegraphics [width=13cm]{H0892f11.ps}
}\end{figure}](/articles/aas/full/1998/18/h0892/Timg24.gif)
![\begin{figure}
{
\includegraphics [width=13cm]{H0892f12.ps}
}\end{figure}](/articles/aas/full/1998/18/h0892/Timg25.gif)
Figure 1:
continued
![\begin{figure}
{
\includegraphics [width=13cm]{H0892f13.ps}
}\end{figure}](/articles/aas/full/1998/18/h0892/Timg26.gif)
![\begin{figure}
{
\includegraphics [width=13cm]{H0892f14.ps}
}\end{figure}](/articles/aas/full/1998/18/h0892/Timg27.gif)
![\begin{figure}
{
\includegraphics [width=13cm]{H0892f15.ps}
}\end{figure}](/articles/aas/full/1998/18/h0892/Timg28.gif)
Figure 1:
continued
![\begin{figure}
{
\includegraphics [width=13cm]{H0892f16.ps}
}\end{figure}](/articles/aas/full/1998/18/h0892/Timg29.gif)
![\begin{figure}
{
\includegraphics [width=13cm]{H0892f17.ps}
}\end{figure}](/articles/aas/full/1998/18/h0892/Timg30.gif)
![\begin{figure}
{
\includegraphics [width=13cm]{H0892f18.ps}
}\end{figure}](/articles/aas/full/1998/18/h0892/Timg31.gif)
Figure 1:
continued
![\begin{figure}
{
\includegraphics [width=13cm]{H0892f19.ps}
}\end{figure}](/articles/aas/full/1998/18/h0892/Timg32.gif)
![\begin{figure}
{
\includegraphics [width=13cm]{H0892f20.ps}
}\end{figure}](/articles/aas/full/1998/18/h0892/Timg33.gif)
![\begin{figure}
{
\includegraphics [width=13cm]{H0892f21.ps}
}\end{figure}](/articles/aas/full/1998/18/h0892/Timg34.gif)
Figure 1:
continued
![\begin{figure}
{
\includegraphics [width=13cm]{H0892f22.ps}
}\end{figure}](/articles/aas/full/1998/18/h0892/Timg35.gif)
![\begin{figure}
{
\includegraphics [width=13cm]{H0892f23.ps}
}\end{figure}](/articles/aas/full/1998/18/h0892/Timg36.gif)
![\begin{figure}
{
\includegraphics [width=13cm]{H0892f24.ps}
}\end{figure}](/articles/aas/full/1998/18/h0892/Timg37.gif)
Figure 1:
continued
![\begin{figure}
{
\includegraphics [width=13cm]{H0892f25.ps}
}\end{figure}](/articles/aas/full/1998/18/h0892/Timg38.gif)
![\begin{figure}
{
\includegraphics [width=13cm]{H0892f26.ps}
}\end{figure}](/articles/aas/full/1998/18/h0892/Timg39.gif)
![\begin{figure}
{
\includegraphics [width=13cm]{H0892f27.ps}
}\end{figure}](/articles/aas/full/1998/18/h0892/Timg40.gif)
Figure 1:
continued
![\begin{figure}
{
\includegraphics [width=13cm]{H0892f28.ps}
}\end{figure}](/articles/aas/full/1998/18/h0892/Timg41.gif)
![\begin{figure}
{
\includegraphics [width=13cm]{H0892f29.ps}
}\end{figure}](/articles/aas/full/1998/18/h0892/Timg42.gif)
![\begin{figure}
{
\includegraphics [width=13cm]{H0892f30.ps}
}\end{figure}](/articles/aas/full/1998/18/h0892/Timg43.gif)
Figure 1:
continued
![\begin{figure}
{
\includegraphics [width=13cm]{H0892f31.ps}
}\end{figure}](/articles/aas/full/1998/18/h0892/Timg44.gif)
![\begin{figure}
{
\includegraphics [width=13cm]{H0892f32.ps}
}\end{figure}](/articles/aas/full/1998/18/h0892/Timg45.gif)
![\begin{figure}
{
\includegraphics [width=13cm]{H0892f33.ps}
}\end{figure}](/articles/aas/full/1998/18/h0892/Timg46.gif)
Figure 1:
continued
![\begin{figure}
{
\includegraphics [width=13cm]{H0892f34.ps}
}\end{figure}](/articles/aas/full/1998/18/h0892/Timg47.gif)
![\begin{figure}
{
\includegraphics [width=13cm]{H0892f35.ps}
}\end{figure}](/articles/aas/full/1998/18/h0892/Timg48.gif)
![\begin{figure}
{
\includegraphics [width=13cm]{H0892f36.ps}
}\end{figure}](/articles/aas/full/1998/18/h0892/Timg49.gif)
Figure 1:
continued
![\begin{figure}
{
\includegraphics [width=13cm]{H0892f37.ps}
}\end{figure}](/articles/aas/full/1998/18/h0892/Timg50.gif)
![\begin{figure}
{
\includegraphics [width=13cm]{H0892f38.ps}
}\end{figure}](/articles/aas/full/1998/18/h0892/Timg51.gif)
![\begin{figure}
{
\includegraphics [width=13cm]{H0892f39.ps}
}\end{figure}](/articles/aas/full/1998/18/h0892/Timg52.gif)
Figure 1:
continued
![\begin{figure}
{
\includegraphics [width=13cm]{H0892f40.ps}
}\end{figure}](/articles/aas/full/1998/18/h0892/Timg53.gif)
![\begin{figure}
{
\includegraphics [width=13cm]{H0892f41.ps}
}\end{figure}](/articles/aas/full/1998/18/h0892/Timg54.gif)
![\begin{figure}
{
\includegraphics [width=13cm]{H0892f42.ps}
}\end{figure}](/articles/aas/full/1998/18/h0892/Timg55.gif)
Figure 1:
continued
![\begin{figure}
{
\includegraphics [width=13cm]{H0892f43.ps}
}\end{figure}](/articles/aas/full/1998/18/h0892/Timg56.gif)
![\begin{figure}
{
\includegraphics [width=13cm]{H0892f44.ps}
}\end{figure}](/articles/aas/full/1998/18/h0892/Timg57.gif)
Figure 1:
continued
Table 3:
Source list with classification and number of observations at
each frequency

|
Table 3:
continued

|
Table 3:
continued

|
Acknowledgements
This work has been supported by the Academy of
Finland.


Up: Fifteen years monitoring of
Copyright The European Southern Observatory (ESO)
![\begin{figure}
{
\includegraphics [width=13cm]{H0892f01.ps}
}\end{figure}](/articles/aas/full/1998/18/h0892/Timg14.gif)
![\begin{figure}
{
\includegraphics [width=13cm]{H0892f02.ps}
}\end{figure}](/articles/aas/full/1998/18/h0892/Timg15.gif)
![\begin{figure}
{
\includegraphics [width=13cm]{H0892f03.ps}
}\end{figure}](/articles/aas/full/1998/18/h0892/Timg16.gif)
![\begin{figure}
{
\includegraphics [width=13cm]{H0892f01.ps}
}\end{figure}](/articles/aas/full/1998/18/h0892/Timg14.gif)
![\begin{figure}
{
\includegraphics [width=13cm]{H0892f02.ps}
}\end{figure}](/articles/aas/full/1998/18/h0892/Timg15.gif)
![\begin{figure}
{
\includegraphics [width=13cm]{H0892f03.ps}
}\end{figure}](/articles/aas/full/1998/18/h0892/Timg16.gif)