Up: Far-infrared emission from Shakhbazian Groups
The percentage of SCGGs with confident FIR detections ( ) is
appreciably less than in HCGs (64%). One reason for the smaller
percentage of FIR detections among Shakhbazian groups is probably
their large distances.
The median redshift of extragalactic objects selected by their
) is
appreciably less than in HCGs (64%). One reason for the smaller
percentage of FIR detections among Shakhbazian groups is probably
their large distances.
The median redshift of extragalactic objects selected by their
 m IRAS emission is z=0.03 (Kleinmann & Keel 1987).
This corresponds to a median FIR luminosity of
m IRAS emission is z=0.03 (Kleinmann & Keel 1987).
This corresponds to a median FIR luminosity of
 . Among the sample of
  Shakhbazian groups investigated spectroscopically to date, only 5
groups have
Shakhbazian groups investigated spectroscopically to date, only 5
groups have  , and the median redshift is z=0.0825.
Thus only relatively strong FIR sources with luminosity above
, and the median redshift is z=0.0825.
Thus only relatively strong FIR sources with luminosity above
 are detectable at these redshifts.
The redshifts of only 4 Shakhbazian groups
(Shkh 16, 331, 344, and 351) with detected FIR emission are known.
These groups have
60
are detectable at these redshifts.
The redshifts of only 4 Shakhbazian groups
(Shkh 16, 331, 344, and 351) with detected FIR emission are known.
These groups have
60  m luminosities comparable to the most luminous HCGs.
What type of objects could be responsible for the observed FIR
emission in SCGGs? A dominant population in HCGs are E/S0 galaxies,
that are known to be very weak FIR emitters compared to later Hubble
types (de Jong et al. 1984). Galaxy-galaxy interactions involving
close, penetrating collisions, which are expected to be frequent
in compact groups, are believed to trigger star formation processes
or non-thermal nuclear activity associated with Seyfert nuclei. The
latter are often associated with strong far-infrared flux (Antonucci
& Olszewski 1985, 1986; Aaronson & Olszewski 1984) and they are believed to be the main source of FIR
emission in dense groups. Even galaxies with mild activity according
to the Byurakan classification of galaxies (Kalloglian & Tovmassian
1964) are relatively strong FIR emitters (Tovmassian
1994). At the same time, it is known that starburst and
Seyfert galaxies are relatively blue objects.
Unfortunately, at present there is insufficient photometric data on
the Shakhbazian groups to determine whether groups with detected FIR
emission contain bluer galaxies on average than those undetected by IRAS.
Recent searchers for signatures of tidal interactions and merging in
the early-type galaxies that dominate HCGs (Zepf et al. 1991,
Bettoni & Fasano 1993; Zepf 1993;
Whitmore et al.
1993; Fasano & Bettoni 1994) have found that very
few elliptical galaxies in HCGs have colors indicating recent star
formation. In addition, the morphologies of galaxies in HCGs reveal
only moderate evidence for tidal interactions and few clear cases
of merging. Moles et al. (1994) made an extensive UBV
photometry for 177 galaxies in HCGs and concluded that the star
formation rate in these groups is only weakly enhanced compared
to isolated galaxies. Moreover, Pildis et al. (1995)
stressed that a straightforward explanation of the interaction
history of HCGs is rather difficult. In addition, Kennicutt et al.
(1987) showed that interaction-enhanced star formation
is only a marginal effect in optically selected samples, while
interactions are more significant in FIR-selected galaxy samples.
Proceeding from the morphological types of the constituent galaxies,
N-body simulations suggest that Shakhbazian groups are a
longer-lasting and more evolved type of system than the HCGs.
Indeed, SCGGs contain on average a higher percentage of E's and S0's
than the HCGs. While E and S0 galaxies comprise about 51% of
galaxies in HCGs (Hickson et al. 1989), the fraction of E/S0
galaxies in a sample of 243 galaxies in SCGGs is 77% (Tiersch et al. 1996b). Thus the fraction of spirals, which have higher FIR
luminosity for a given optical luminosity than E and S0 galaxies, is
smaller among SCGGs than in the HCGs. It is remarkable that FIR
emission was detected from only two (Shkh 16 and 351) out of 10 SCGGs
with  , while about half of HCGs at these redshifts has
detectable FIR emission.
Another possibility is that in the dense environments
of SCGGs the gas and dust in disk galaxies may be swept out after
numerous encounters. This, combined with the greater distances of SCGGs
would explain their low IRAS detection rate compared to HCGs.
, while about half of HCGs at these redshifts has
detectable FIR emission.
Another possibility is that in the dense environments
of SCGGs the gas and dust in disk galaxies may be swept out after
numerous encounters. This, combined with the greater distances of SCGGs
would explain their low IRAS detection rate compared to HCGs.
Recent studies (Tiersch et al. 1997) show that a significant
fraction of Shakhbazian groups contain emission-line objects,
including some Seyfert galaxies. Emission-line galaxies have been
found in approximately one third (12 out of 36) of SCGGs which have
been investigated spectroscopically to date. Assuming that this
fraction is typical also for the SCGGs detected by IRAS (which do not
yet have spectral data), and assuming that about 50% of Seyfert
galaxies have 60 m luminosities in excess of  (Miley et al. 1985), using the above mentioned
approximate limit of detectability at the typical redshifts of SCGGs
(
(Miley et al. 1985), using the above mentioned
approximate limit of detectability at the typical redshifts of SCGGs
( ), the FIR detection fraction of
for SCGGs may be explained by gas-rich newcomers falling
from the outskirts of the groups into their inner region, where
strong gravitational interactions result in star formation and
enhanced FIR luminosity.
), the FIR detection fraction of
for SCGGs may be explained by gas-rich newcomers falling
from the outskirts of the groups into their inner region, where
strong gravitational interactions result in star formation and
enhanced FIR luminosity.
A number of SCGGs with IRAS detections also have radio continuum
emission, which is generally characteristic of AGNs. Some SCGGs have
an X-ray counterpart that may be due to the AGN of a corresponding
galaxy in the group, or, more likely, to a hot intracluster gas
(Tiersch et al. 1996a).
Future work should include spectroscopic observations of members
of Shakhbazian groups, especially those with detected IRAS emission,
in order to determine their distances, velocity dispersion, masses,
luminosities, colors and other properties.
Acknowledgements
HMT and GHT are grateful to IPAC and JPL for financial support during
the work at the IPAC, and to C. Beichman for hospitality. HMT was
supported by the CONACYT research grant No. 5-000PE and by the DAAD.
JMM was supported by the Jet Propulsion Laboratory, California
Institute of Technology, under contract with NASA. HT is grateful to
the Government of the land Brandenburg for the support of this work
and DS acknowledges the support of the Deutsche Forschungsgemeinschaft,
DFG project number TI 215/7-1.
Table 1:
IRAS sources detected at the position of SCGGs
 |
Remarks to Table 1:
In the remarks below, F designates IRAS Faint Source Catalog sources, and
Z designates Faint Source Catalog Reject sources.
- Shkh 013.
- F16441+5348. SCANPI shows source confusion
at 100 m peaked about -4
 in the in-scan direction.
FRESCO confirms foreground confusion at 100 m.
Therefore FSC flux densities are used. May be combined emission of
very close galaxies 1 and 2.
in the in-scan direction.
FRESCO confirms foreground confusion at 100 m.
Therefore FSC flux densities are used. May be combined emission of
very close galaxies 1 and 2.
- Shkh 014.
- F14234+4729. SCANPI template amplitude measurements
used: confirms
 m) from FSC, and adds a reliable
  m)
detection. May be combined emission of bright galaxies 2, 3, 5 and 6.
m)
detection. May be combined emission of bright galaxies 2, 3, 5 and 6.
- Shkh 016.
- F16480+5329. SCANPI at the position of F16480+5329
reproduces the FSC estimate at 60 m, but adds a reliable
100 m detection. May be combined emission of galaxies 1, 2 and 3.
Galaxy 3 is closest. The group is known also as I Zw 167 and Arp 330.
z=0.02913 (Amirkhanian 1989). A radio source was observed at
the position of the galaxy 1 (Gregory & Condon 1991;
White &
Becker 1992; Visser et al. 1995;
Douglas et al. 1996).
- Shkh 022.
- Z15445+5515. SCANPI confirms FSCR 60 m
measurement and adds reliable 100 m detection at position of Z15445+5515.
May be integrated emission of galaxy pair 4 and 5.
- Shkh 063.
- Z11268+4243. SCANPI flux densities
at the position of Z11268+4243 are used here.
- Shkh 065.
- Z11282+3517. The FIR source coincides with galaxy 27.
SCANPI flux densities at the position of the FSCR source are listed;
SCANPI confirms m) from
the FSCR and adds an estimate for m). It has a radio
counterpart FIRST J113055.0+350104 (Becker et al. 1995).
The group is identical with the cluster of galaxies A 1284.
- Shkh 074.
- F14189+4317.
SCANPI estimates at the position of the FSC source are listed.
SCANPI m) agrees with the FSC within the uncertainties,
and SCANPI provides an estimate for m).
The IRAS source is associated with the eastern subgroup.
- Shkh 104.
- Z09236+5311. SCANPI flux densities at position
of the FSCR source are listed here. m) agrees with the FSC
within the uncertainties, and SCANPI provides an estimate for m).
May be combined emission of galaxies 2 and 3.
- Shkh 135.
- F16129+6428. SCANPI fluxes at the position of
the FSC source are listed.
- Shkh 168.
- Z18340+8303. SCANPI fluxes at the position of the FSCR
source are listed. Galaxies 1, 3, 4 and 5 are located in the central area
of isophots. The radio source 8C 1834+830 (Hales et al. 1995) is at
RA=18
 27
27 56
56 5, Dec= 83
 0555
0555 , at a distance
of 0.3 arcmin from galaxies 5 and 6.
, at a distance
of 0.3 arcmin from galaxies 5 and 6.
- Shkh 176.
- F00057+2942.
SCANPI fluxes at the position of the FSCR source are listed.
May be combined emission of galaxies 1 and 4. Galaxies 5 and 9 are
located nearby.
- Shkh 243.
- SCANPI measurements are listed here. A source size
larger than the IRAS 100 m beam, very cool color temperature,
and lack of a FSC or FSCR counterpart suggest this is possibly Galactic
cirrus. The FIR source may be galaxy 7. The radio source
FIRST J120932.9+322541 (Becker et al. 1995) is at about 1 arcmin
from galaxy 7.
- Shkh 248.
- F13099+3626. SCANPI measurements at the position
of the FSC source are listed here. The nearest galaxy to the center
of isophots is the brightest galaxy 4. Galaxies 1, 3, 5 and 8 are nearby.
The radio source FIRST J131213.1+361311 (Becker et al. 1995) is at
about 2 arcmin from galaxy 4.
- Shkh 251.
- F13346+3705. SCANPI measurements at the position of
the FSC source are listed here. May be combined emission of galaxies 1 and 2.
The radio source FIRST J133647.3+364948 (Becker et al. 1995) is at
about 1 arcmin from the mentioned pair of galaxies.
- Shkh 254.
- Z13541+3526. SCANPI measurements at the position of
the FSCR source are listed here. Galaxy 3 is the closest to the center
of isophots. Nearby are
galaxies 1, 7, 8, 9 and 10. The radio source
FIRST J135619.1+351119 (Becker et al. 1995) is at the position of
galaxy 3.
- Shkh 257.
- F14449+3745. SCANPI measurements at the position of
the FSC source are listed here; SCANPI confirms m) from the
FSC and adds a reliable m) measurement.
May be combined emission of galaxies 1 and 6.
- Shkh 270.
- F02062-1411. SCANPI measurements at the position of
the FSC source are listed here. SCANPI and FRESCO suggest a point source
embedded behind Galactic cirrus. The brightest galaxy 1, and also
galaxy 2 are closest to the center of isophots.
- Shkh 273.
- F02505-1318. SCANPI measurements at the position of
the FSC source are listed here.
May be combined emission of galaxies 3, 5 and 6. Nearby are galaxies 2 and 4.
- Shkh 310.
- F00523-0359. SCANPI measurements at the position of
the FSC source are listed here. Galaxy 3 is in the center of isophots.
Galaxies 1, 2, 4, 5 and 6 are located nearby.
- Shkh 331.
- Z22228-0302. SCANPI measurements at the position of
the FSCR source are listed here. The brightest galaxy 7 of the group
together with closest galaxies 3, 4 and 5 are located in the center
of isophots.
- Shkh 344.
- Z08450+0353. SCANPI measurements at the position of
the FSCR source are listed here. z=0.0782 (Tiersch et al., in preparation)
Galaxy 1 is the closest to the center of isophots. Galaxies 3, 4 and 7 are
located neraby.
- Shkh 351.
- F11078+0505.
SCANPI measurements at the position of the FSC source are listed here.
The source is identified with the brightest galaxy 6 (UGC 06212),
located in the center of isophots. It has the same z=0.030
(Mathewson & Ford 1996), as other galaxies of the group
(Kodaira et al. 1991, and Tiersch et al., in preparation). SCANPI shows
a very weak source with )
 0.3 Jy
about 2.5 from the bright peak of F11078+0505. This corresponds to
the distorted FRESCO contours at this location (Fig. 2), and may
represent emission associated with galaxy 4 or 5 in Shkh 351.
0.3 Jy
about 2.5 from the bright peak of F11078+0505. This corresponds to
the distorted FRESCO contours at this location (Fig. 2), and may
represent emission associated with galaxy 4 or 5 in Shkh 351.
- Shkh 371.
- F11409+2211. SCANPI measurements at the position of
the FSC source are listed here. All 5 galaxies of this very compact
group are located in the central area of isophots.
- Shkh 376.
- Z13542+2336. SCANPI measurements at the position of
the FSCR source are listed here. The extended 60 m and
100 m emission and cool color temperature suggest possible
cirrus confusion.
Table 2:
IRAS Sources with uncertain SCGG Associations
|
|
Remarks to Table 2:
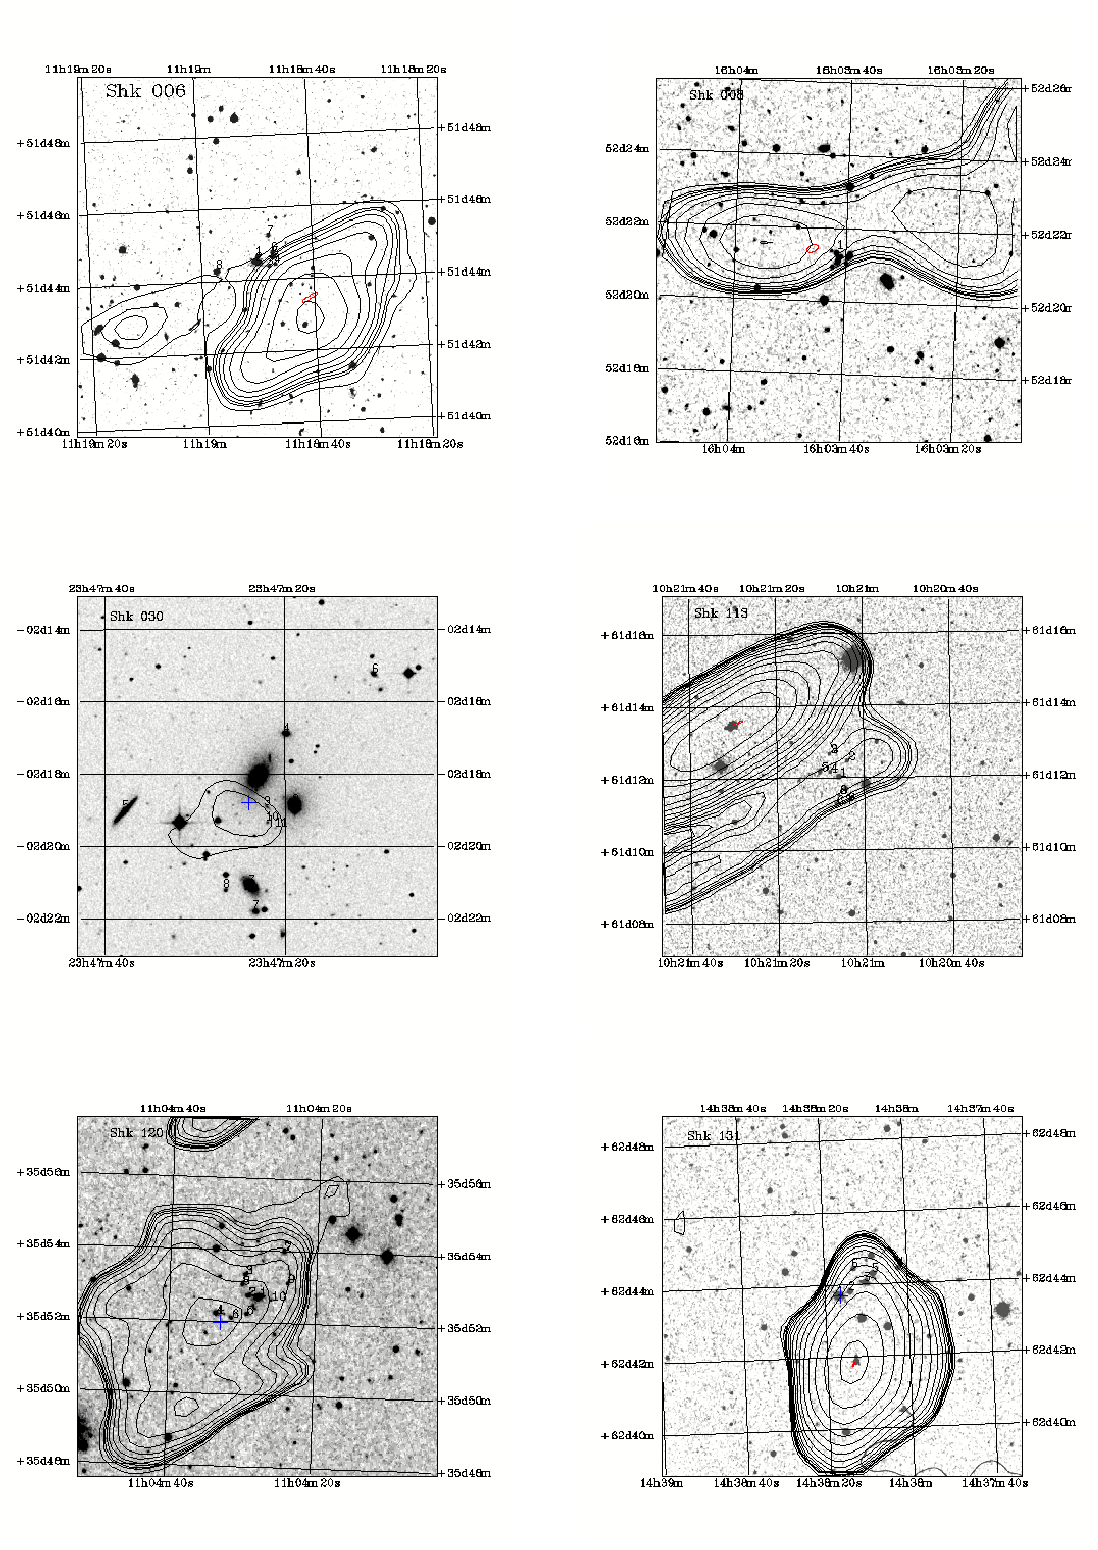
- Shkh 006.
- F11158+5159 is about 1.5 SW from the group.
The large distance from the group in the in-scan direction make
association unlikely.
SCANPI measurements listed, providing a reliable 100 m detection;
m) agrees with FSC within errors.
- Shkh 008.
- Z16024+5229 is near galaxy 1. SCANPI measurements
listed; use of template amplitude (tmp) fit omits flux from nearby
confusing source. SCANPI also provides a reliable m),
that the FSCR does not, and agrees well with FSCR at 25 and
60 m. Uncertainty in association is because FRESCO
suggests that the weak 60 m point-source could be confused by
large-scale emission from two bright Galactic cirrus or molecular
clouds on each side of the group (cf. Fig. 3).
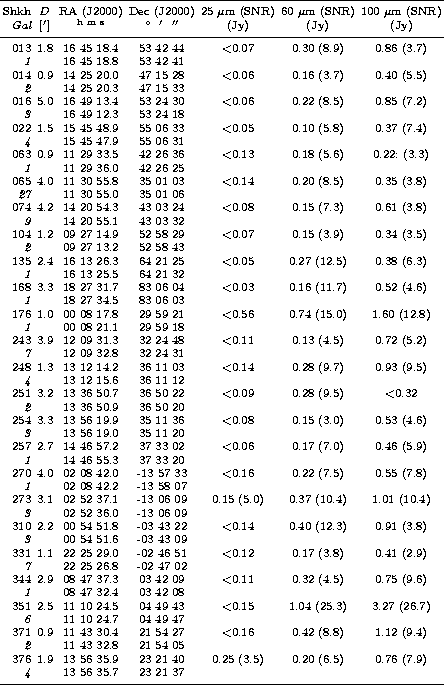
- Shkh 030.
- Coincides with HCG 97.
z=0.0218 (Hickson et al. 1988; Amirkhanian 1989).
SCANPI shows a weak extended source at 60 m centered at
the given position; an extended 100 m source is
centered 2 away, suggesting foreground confusion.
The lack of IRAS FSC or FSCR counterparts,
or a FIRST radio continuum source,
make this IRAS association very uncertain.
- Shkh 113.
- The source located about 3 NE from the galaxy
group is F10180+6128; it has m)= 0.56 Jy. The weak source
coincident with the position of Shkh 113 in the 60 m FRESCO
image (Fig. 3) also appears as a distinct object with SCANPI.
However, the total flux within the zero-crossings of the
baseline fit
(-0.9 to 0.8) at the position of galaxy 1 is only m)=0.06 Jy;
this is less than a  signal, so upper limits at the position
of galaxy 1 are listed here.
signal, so upper limits at the position
of galaxy 1 are listed here.
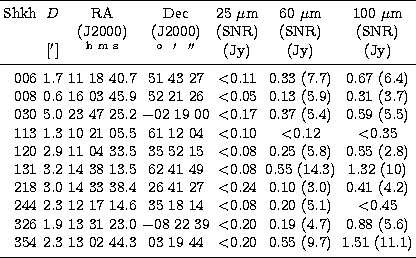
- Shkh 120.
- The 60 m emission in the FRESCO image
peaks near galaxy 4.
The lack of a corresponding source in the FSC or FSCR, extended
nature of the emission in FRESCO, offsets in the centroids of the
60 m and 100 m emission, and large-scale correlated noise
visible with SCANPI suggests this is foreground cirrus emission.
The FIRST radio source J110433.1+355222 (Becker et al. 1995)
coinsides with galaxy 4. The radio source is registered also
in Gregory & Condon (1991).
- Shkh 131.
- Fluxes listed are from the FSC for F14370+6254,
centered about 1 south of the group. This is the source at the
center of the FRESCO isophotes in Fig. 3.
SCANPI does not show a source distinct from
F14370+6254; Shkh 131 is located near the edge of the 60 m beam.
- Shkh 218.
- The source about 3 SW of the galaxy group
is Z14312+2654.
SCANPI shows a double source separated by 3 at 60 m;
the NW component is the weak source at the location of the galaxy group
(see Fig. 3). Flux density estimates listed here are from SCANPI;
they are uncertain because of the lack of a FSC or FSCR counterpart,
and possible cirrus confusion.
- Shkh 244.
- The FRESCO 60 m image shows an extended double structure in the
east-west direction, and the 100 m SCANPI data suggest possible
cirrus. A 60 m-only detection with no FSC or FSCR entry is
always suspect for a faint point source.
The radio source FIRST J121710.9+351757 (Becker et al. 1995)
is very close (<1 arcmin) from galaxy 4.
- Shkh 326.
- SCANPI measurements are listed. The source is not
in the FSC or FSCR, and appears in SCANPI as a weak extended source.
The color temperature and extended 60 m and 100 m
emission suggest cirrus confusion.
- Shkh 354.
- F13001+0335. SCANPI measurements at the position
of the FSC source are listed here.
The 60 m and 100 m profiles are slightly extended,
and the large distance from any Shkh 354 galaxy makes the IRAS
association with the group Shkh 354 highly uncertain.
The DSS image shows another faint source much closer to the
FSR positional uncertainty ellipse.
 |
Figure 2:
Isophots of the FIR sources (IRAS) at 60 m in
arbitrary units overlayed on the POSS (DSS) images of Shakhbazian groups.
The crosses in some of the figures mark the center of the image |
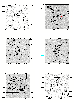 |
Figure 2:
continued |
 |
Figure 2:
continued |
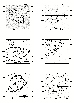 |
Figure 2:
continued |
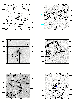 |
Figure 3:
Isophots of the FIR sources (IRAS) detected in the
vicinities of SCGGs at 60 m in arbitrary units
overlayed on the POSS images of Shakhbazian groups.
The crosses in some of the figures mark the center of the image |
 |
Figure 3:
continued |
Up: Far-infrared emission from Shakhbazian Groups
Copyright The European Southern Observatory (ESO)